The accident analysis diagram example "Accident analytic tree" was redesigned from the picture 7-14 from the "DOE Workbook. Conducting Accident Investigations. Revision 2."
"Analytic tree analyses are well defined, useful methods that graphically depict, from beginning to end, the events and conditions preceding and immediately following an accident. An analytic tree is a means of organizing information that helps the investigator conduct a deductive analysis of any system (human, equipment, or environmental) to determine critical paths of success and failure. Results from this analysis identify the details and interrelationships that must be considered to prevent the oversights, errors, and omissions that lead to failures. In accident investigations, this type of analysis can consist of both failure paths and success paths, and can lead to neutral, negative, or positive conclusions regarding accident severity.
TIP.
An analytic tree enables the user to:
(1) Systematically identify the possible paths from events to outcome.
(2) Display a graphical record of the analytical process.
(3) Identify management system weaknesses and strengths."
[homer.ornl.gov/ sesa/ corporatesafety/ aip/ docs/ workbook/ Rev2/ chpt7/ chapt7.htm]
The FTA diagram example "Accident analytic tree" was created using the ConceptDraw PRO diagramming and vector drawing software extended with the Fault Tree Analysis Diagrams solution from the Engineering area of ConceptDraw Solution Park.
FTA diagram

Fault Tree Diagram

 Fault Tree Analysis Diagrams
This solution extends ConceptDraw PRO v9.5 or later with templates, fault tree analysis example, samples and a library of vector design elements for drawing FTA diagrams (or negative analytical trees), cause and effect diagrams and fault tree diagrams.
Fault Tree Analysis Software

First of all, Fault Tree Analysis Diagrams Solution provides a set of samples which are the good examples of easy drawing professional looking Fault Tree Analysis Diagrams.
The vector stencils library "Fault tree analysis diagrams" contains 12 symbols for drawing Fault Tree Analysis (FTA) diagrams.
"Fault tree analysis (FTA) is a top down, deductive failure analysis in which an undesired state of a system is analyzed using Boolean logic to combine a series of lower-level events. This analysis method is mainly used in the fields of safety engineering and reliability engineering to understand how systems can fail, to identify the best ways to reduce risk or to determine (or get a feeling for) event rates of a safety accident or a particular system level (functional) failure. FTA is used in the aerospace, nuclear power, chemical and process, pharmaceutical, petrochemical and other high-hazard industries; but is also used in fields as diverse as risk factor identification relating to social service system failure.
In aerospace, the more general term "system Failure Condition" is used for the "undesired state" / Top event of the fault tree. These conditions are classified by the severity of their effects. The most severe conditions require the most extensive fault tree analysis. These "system Failure Conditions" and their classification are often previously determined in the functional Hazard analysis." [Fault tree analysis. Wikipedia]
The shapes example "Fault tree analysis diagrams" was created using the ConceptDraw PRO diagramming and vector drawing software extended with the Fault Tree Analysis Diagrams solution from the Engineering area of ConceptDraw Solution Park.
FTA diagram symbols

This flowchart example was created on the base of land sales process diagram from the Property management webpage of the VicRoads website.
[www.vicroads.vic.gov.au/ planning-and-projects/ property-services/ property-management]
"VicRoads or the Roads Corporation of Victoria is a statutory corporation which is the state road and traffic authority in the state of Victoria, Australia. It is responsible for maintenance and construction of the state arterial road network, as well as driver licensing and vehicle registration. VicRoads has broad responsibility for road safety policy and research. It is also responsible for regulating the accident towing industry in Victoria." [VicRoads. Wikipedia]
"Sales Process.
Once it has been established with the relevant VicRoads Regions/ Projects and other business areas that properties are identified as surplus to VicRoads’ operational needs, they are incorporated in the VicRoads annual sales program.
Following approval: relevant VicRoads Regional Manager and the VicRoads Chief Executive (and in some circumstances Minster for Public Transport and Roads) must approve all land deemed surplus and available for disposal.
The method of sale is then determined and consultant advice is sought:
(1) Planning.
(2) Valuer General Victoria (Valuer General’s office must provide a valuation for all sales).
(3) Government Land Monitor (Land Monitor approval is sought if the value exceeds $750,000).
(4) Environmental.
(5) Local Council." [www.vicroads.vic.gov.au/ planning-and-projects/ property-services/ property-management]
The example "Land sales process flowchart" was created using the ConceptDraw PRO diagramming and vector drawing software extended with the Sales Flowcharts solution from the Marketing area of ConceptDraw Solution Park.
Sales process chart

What Is an Action Mind Map

How To Give Quick and Professional Responses to Social Media Mentions

The vector stencils library "Fire safety equipment" contains 19 clipart images of fire safety equipment which you can easy use in your presentations and illustrations.
"Fire safety refers to precautions that are taken to prevent or reduce the likelihood of a fire that may result in death, injury, or property damage, alert those in a structure to the presence of an uncontrolled fire in the event one occurs, better enable those threatened by fire to survive in and evacuate from affected areas, or to reduce the damage caused by a fire. Fire safety measures include those that are planned during the construction of a building or implemented in structures that are already standing, and those that are taught to occupants of the building.
Threats to fire safety are referred to as fire hazards. A fire hazard may include a situation that increases the likelihood a fire may start or may impede escape in the event a fire occurs." [Fire safety. Wikipedia]
The clip art example "Fire safety equipment - Vector stencils library" was created in the ConceptDraw PRO diagramming and vector drawing software using the Presentation Clipart solution from the Illustration area of ConceptDraw Solution Park.
www.conceptdraw.com/ solution-park/ illustrations-presentation-clipart
Figure

Fire door

Alarm CO detector

Bell

CO detector

Manual call point

Smoke detector 2

Fire Alarm Siren

Loudspeaker

Fire extinguisher

Fire alarm control panel

Fire bucket

High-resolution CCD digital camera
Infrared system for early fire detection

Infrared thermal imaging

Smoke detector

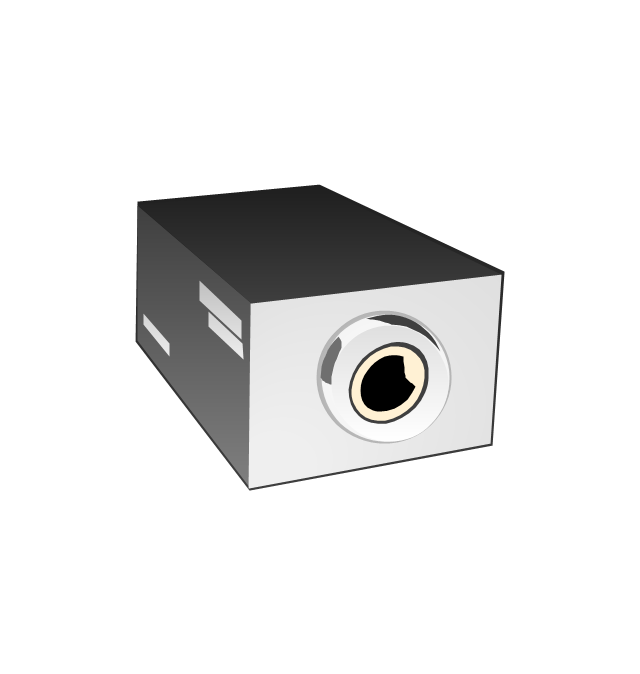
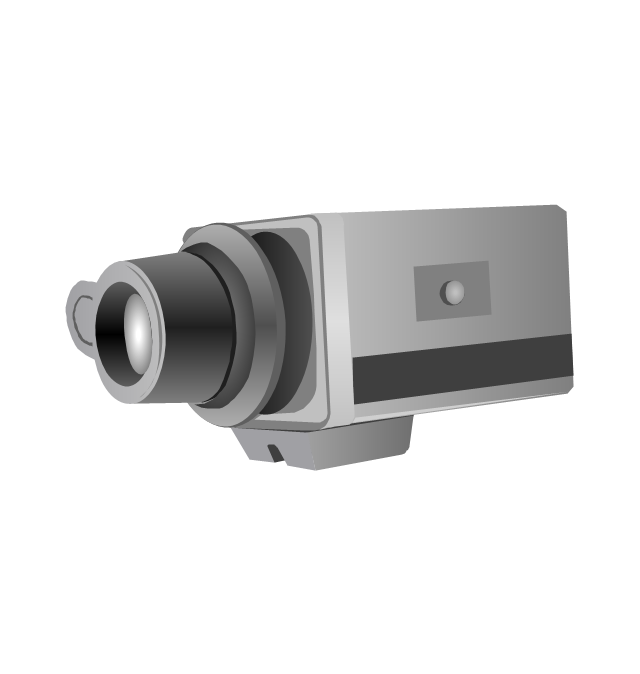
Security camera
Thermographic process control system

Beacon
Manage Social Media Response Plan DFD

That Helps Professional Social Media Teams

Social Media Response Management Action Maps - software tool


Response to Customer Negative Feedback

Interactive Flowcharts can change the way one creates and organizes their social media response process.
The Means to Respond to Social Media Mentions

- Traffic Accident Drawing
- Accident analytic tree - FTA diagram | Fault Tree Diagram | Fault ...
- Accident Diagram Car Template
- FTA diagram - Hazard analysis | Accident analytic tree - FTA ...
- Fault Tree Diagram | Accident analytic tree - FTA diagram | Fault ...
- Accident analytic tree - FTA diagram | Fault Tree Analysis Diagrams ...
- Accident Scene Diagram Template
- Building Drawing Software for Design Seating Plan | Fault Tree ...
- Chemical Process Accident Drawing
- Draw Accident Free Download
- Accident Drawing Car And Bike
- Accident Drawing Hd
- Road Accident Drawing
- Car Accident Diagram Template
- Path Diagram Analysis Road Accident
- Piping and instrumentation diagram template | Accident analytic tree ...
- Accident analytic tree - FTA diagram | SYSML | IDEF0 Diagrams ...
- Accident analytic tree - FTA diagram | ConceptDraw Solution Park ...
- Draw A Chart About Accident Safety
- Fault Tree Analysis For Car Accident
- ERD | Entity Relationship Diagrams, ERD Software for Mac and Win
- Flowchart | Basic Flowchart Symbols and Meaning
- Flowchart | Flowchart Design - Symbols, Shapes, Stencils and Icons
- Flowchart | Flow Chart Symbols
- Electrical | Electrical Drawing - Wiring and Circuits Schematics
- Flowchart | Common Flowchart Symbols
- Flowchart | Common Flowchart Symbols