UML Diagram

Create unified modeling language (UML) diagrams with ConceptDraw.
 Business and Finance
Use Business and Finance solution to make professional-looking documents, presentations and websites, business, finance, advertising, and project management illustrations, or any designs that requires clipart of currency, office, business, advertising, management, marketing, people, time, post, contacts, collaboration, etc.
 Audit Flowcharts
Audit flowcharts solution extends ConceptDraw DIAGRAM software with templates, samples and library of vector stencils for drawing the audit and fiscal flow charts.
 Business Process Diagrams
Business Process Diagrams solution extends the ConceptDraw DIAGRAM BPM software with RapidDraw interface, templates, samples and numerous libraries based on the BPMN 1.2 and BPMN 2.0 standards, which give you the possibility to visualize equally easy simple and complex processes, to design business models, to quickly develop and document in details any business processes on the stages of project’s planning and implementation.
Financial Trade UML Use Case Diagram Example

This sample shows the work of the Financial Trade sphere and can be used by trading companies, commercial organizations, traders, different exchanges.
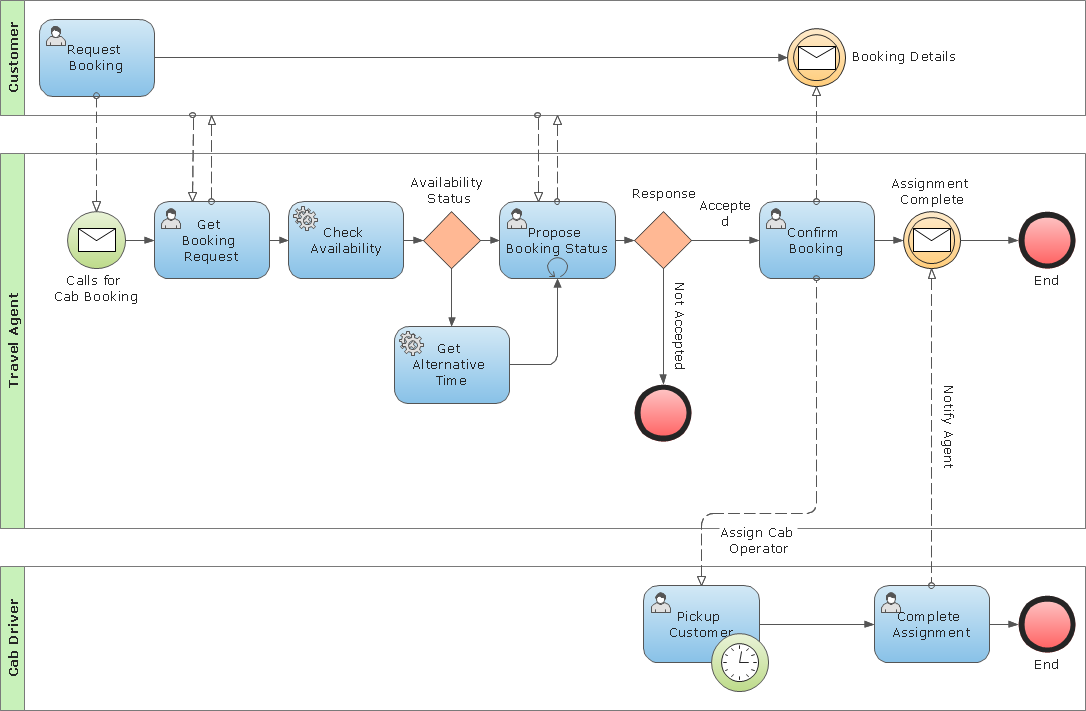
Business Process Modeling Notation Template
Money - Design Elements
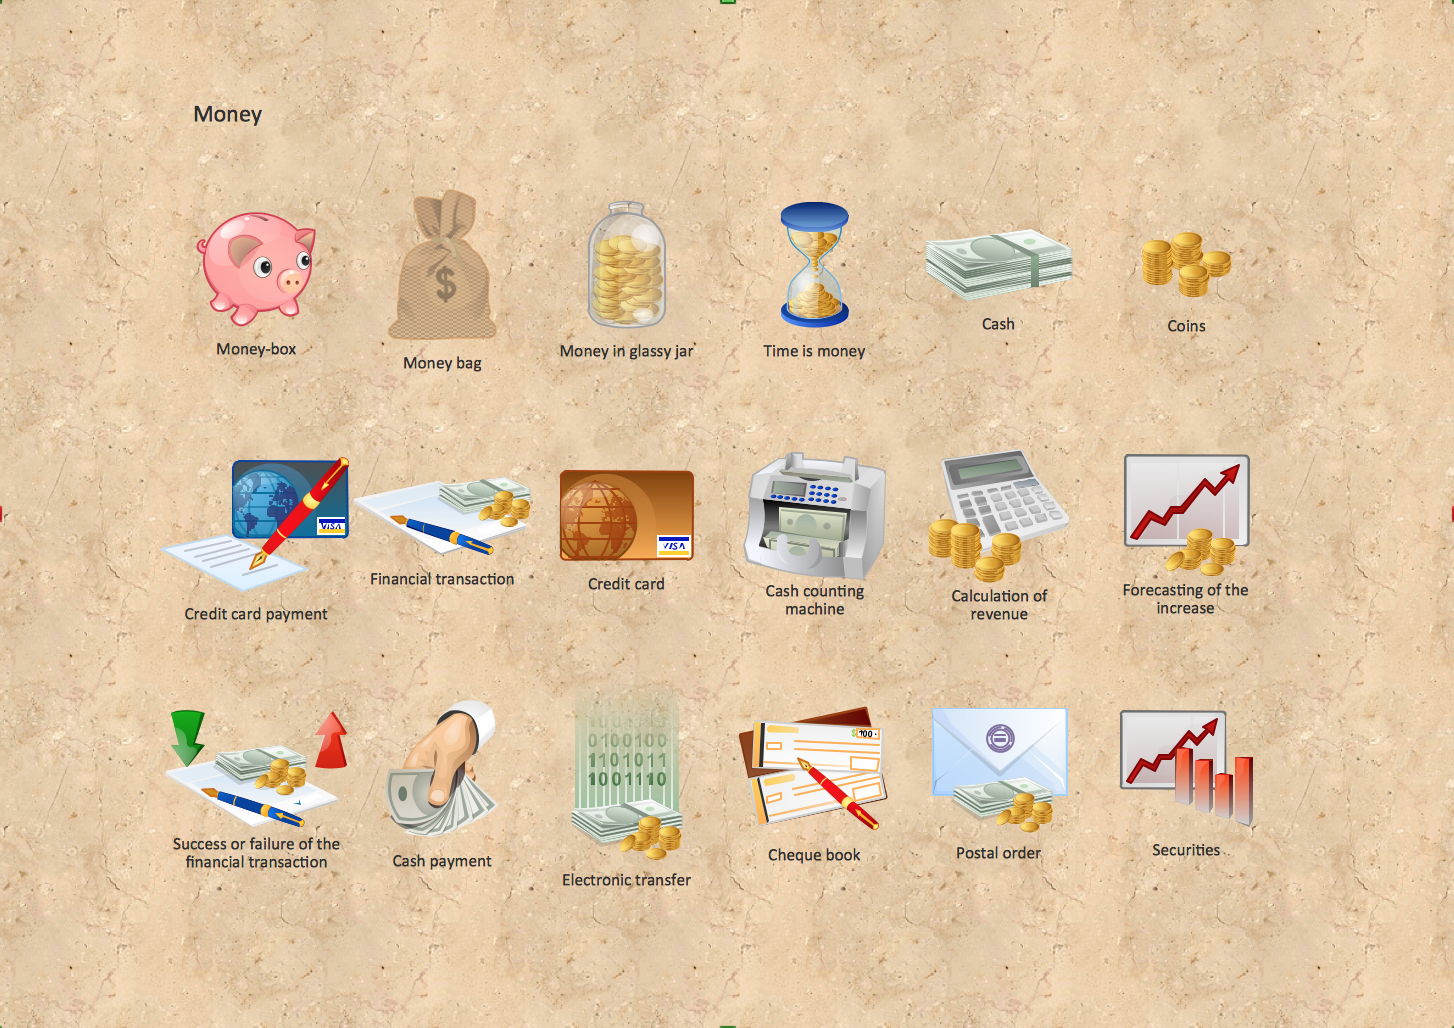
Various styles of money design elements (currency symbols, clipart, money symbols) can be found in ConceptDraw DIAGRAM Business and Finance Solution.
 Event-driven Process Chain Diagrams
Event-Driven Process Chain Diagrams solution extends ConceptDraw DIAGRAM functionality with event driven process chain templates, samples of EPC engineering and modeling the business processes, and a vector shape library for drawing the EPC diagrams and EPC flowcharts of any complexity. It is one of EPC IT solutions that assist the marketing experts, business specialists, engineers, educators and researchers in resources planning and improving the business processes using the EPC flowchart or EPC diagram. Use the EPC solutions tools to construct the chain of events and functions, to illustrate the structure of a business process control flow, to describe people and tasks for execution the business processes, to identify the inefficient businesses processes and measures required to make them efficient.
 Computer Network Diagrams
Computer Network Diagrams solution extends ConceptDraw DIAGRAM software with samples, templates and libraries of vector icons and objects of computer network devices and network components to help you create professional-looking Computer Network Diagrams, to plan simple home networks and complex computer network configurations for large buildings, to represent their schemes in a comprehensible graphical view, to document computer networks configurations, to depict the interactions between network's components, the used protocols and topologies, to represent physical and logical network structures, to compare visually different topologies and to depict their combinations, to represent in details the network structure with help of schemes, to study and analyze the network configurations, to communicate effectively to engineers, stakeholders and end-users, to track network working and troubleshoot, if necessary.
 Venn Diagrams
Venn Diagrams are actively used to illustrate simple set relationships in set theory and probability theory, logic and statistics, mathematics and computer science, linguistics, sociology, and marketing. Venn Diagrams are also often used to visually summarize the status and future viability of a project.
 Value Stream Mapping
Value stream mapping solution extends ConceptDraw DIAGRAM software with templates, samples and vector stencils for drawing the Value Stream Maps (VSM) in lean manufacturing practice.
 Accounting Flowcharts
Accounting Flowcharts solution extends ConceptDraw DIAGRAM software with templates, samples and library of vector stencils for drawing the accounting flow charts.
 Target and Circular Diagrams
This solution extends ConceptDraw DIAGRAM software with samples, templates and library of design elements for drawing the Target and Circular Diagrams.
 Bar Graphs
The Bar Graphs solution enhances ConceptDraw DIAGRAM functionality with templates, numerous professional-looking samples, and a library of vector stencils for drawing different types of Bar Graphs, such as Simple Bar Graph, Double Bar Graph, Divided Bar Graph, Horizontal Bar Graph, Vertical Bar Graph, and Column Bar Chart.
- Financial System Class Diagram
- Class Diagram For Finance Management
- Language Learning | Business and Finance | Circle-Spoke ...
- Entity-Relationship Diagram (ERD) | Bubble Diagrams | Event ...
- Class UML Diagram for Bank Account System | Financial Trade UML ...
- Seven Management and Planning Tools | Class UML Diagram for ...
- UML Sequence Diagram Example. SVG Vectored UML Diagrams ...
- UML Diagram | Financial Trade UML Use Case Diagram Example ...
- Financial Trade UML Use Case Diagram Example | Business and ...
- UML Class Diagram Example for Transport System
- Private And Public Business Diagrams
- Audit Flowcharts | Financial Trade UML Use Case Diagram Example ...
- Block Diagram For Financial Management System
- UML Use Case Diagram Example Registration System | Financial ...
- UML Class Diagram Example for GoodsTransportation System ...
- UML Use Case Diagram Example Registration System | Use Case ...
- Business Diagram Software | UML Class Diagram Example - Social ...
- Business Models | Business model generation diagram | Process ...
- Financial Trade UML Use Case Diagram Example | Audit Flowcharts ...
- Diagramming Software for Design UML Package Diagrams | UML ...
- ERD | Entity Relationship Diagrams, ERD Software for Mac and Win
- Flowchart | Basic Flowchart Symbols and Meaning
- Flowchart | Flowchart Design - Symbols, Shapes, Stencils and Icons
- Flowchart | Flow Chart Symbols
- Electrical | Electrical Drawing - Wiring and Circuits Schematics
- Flowchart | Common Flowchart Symbols
- Flowchart | Common Flowchart Symbols