This typography infographics example was redesigned from the Wikimedia Commons file: Egypt timeline of communication shutdown during jan25revolution.jpg. [commons.wikimedia.org/ wiki/ File:Egypt_ timeline_ of_ communication_ shutdown_ during_ jan25revolution.jpg]
This file is licensed under the Creative Commons Attribution 3.0 Unported license. [creativecommons.org/ licenses/ by/ 3.0/ deed.en]
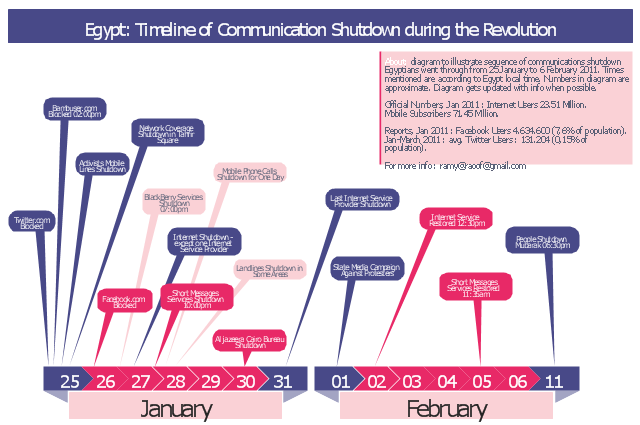
Diagram to illustrate sequence of communications shutdown Egyptians went through from 25 January to 06 February 2011. Times mentioned are according to Egypt local time. Numbers in the diagram are approximate. Last update of the diagram October 2011.
"2011 Internet shutdown.
Diagram to illustrate sequence of communications shutdown Egyptians went through from 25 January to 06 February 2011. Times mentioned are according to Egypt local time. Numbers in the diagram are approximate. Last update of the diagram October 2011.
The 2011 Egyptian protests began on 25 January 2011. As a result, on January 25 and 26, the government blocked Twitter in Egypt and later Facebook was blocked as well.
On January 27, various reports claimed that access to the Internet in the entire country had been shut down. ...
On February 2, connectivity was re-established by the four main Egyptian service providers. A week later, the heavy filtering that occurred at the height of the revolution had ended and bloggers and online activists who had been arrested were released." [Internet in Egypt. Wikipedia]
The example "Egypt timeline of communication shutdown during jan 25 revolution" was created using the ConceptDraw PRO diagramming and vector drawing software extended with the Typography Infographics solition from the area "What is infographics" in ConceptDraw Solution Park.
This file is licensed under the Creative Commons Attribution 3.0 Unported license. [creativecommons.org/ licenses/ by/ 3.0/ deed.en]
Diagram to illustrate sequence of communications shutdown Egyptians went through from 25 January to 06 February 2011. Times mentioned are according to Egypt local time. Numbers in the diagram are approximate. Last update of the diagram October 2011.
"2011 Internet shutdown.
Diagram to illustrate sequence of communications shutdown Egyptians went through from 25 January to 06 February 2011. Times mentioned are according to Egypt local time. Numbers in the diagram are approximate. Last update of the diagram October 2011.
The 2011 Egyptian protests began on 25 January 2011. As a result, on January 25 and 26, the government blocked Twitter in Egypt and later Facebook was blocked as well.
On January 27, various reports claimed that access to the Internet in the entire country had been shut down. ...
On February 2, connectivity was re-established by the four main Egyptian service providers. A week later, the heavy filtering that occurred at the height of the revolution had ended and bloggers and online activists who had been arrested were released." [Internet in Egypt. Wikipedia]
The example "Egypt timeline of communication shutdown during jan 25 revolution" was created using the ConceptDraw PRO diagramming and vector drawing software extended with the Typography Infographics solition from the area "What is infographics" in ConceptDraw Solution Park.
Infographics
Internet solutions with ConceptDraw PRO

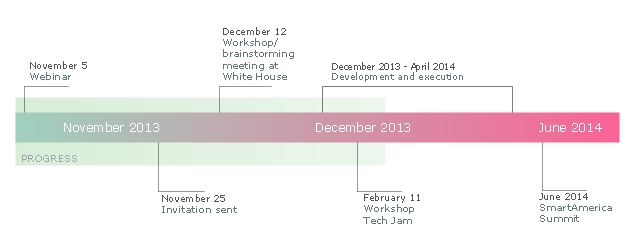
This sample was created on the base of the figure illustrating the webpage "SmartAmerica Challenge Timeline" from the website of the National Institute of Standards and Technology (NIST), an agency of the U.S. Department of Commerce. [nist.gov/ el/ sactl.cfm]
"The SmartAmerica Challenge is a White House Presidential Innovation Fellow project with the goal to bring together research in Cyber-Physical Systems (CPS) and to combine test-beds, projects and activities from different sectors, such as Smart Manufacturing, Healthcare, Smart Energy, Intelligent Transportation and Disaster Response, to show tangible and measurable benefits to the US economy and the daily lives of American citizens.
Cyber-Physical Systems is a name for the combination of the Internet of Things and System Control. So rather than just being able to “sense” where something is, CPS adds the capability to control the “thing” or allow it to interact with physical world around it.
Over 65 Companies, Government Agencies and Academic institutions came together on December 12, 2013 and launched 12 teams/ projects. Since that time 12 new projects have been formed. These teams have been hard at work over the past months building systems, prototypes, pilots and products that demonstrate the capabilities of CPS, but more importantly as the goal of the SmartAmerica Challenge they will show how these technologies will deliver socio-economic benefits to America.
The Challenge will culminate with the SmartAmerica Expo on June 11 at the Washington DC Convention Center." [smartamerica.org/ about/ ]
The timeline diagram example "" was created using the ConceptDraw PRO diagramming and vector drawing software extended with the Timeline Diagrams solution from the Management area of ConceptDraw Solution Park.
Timeline diagram
 ConceptDraw Solution Park
ConceptDraw Solution Park collects graphic extensions, examples and learning materials
Garrett IA Diagrams with ConceptDraw PRO

 Network Security Diagrams
The Network Security Diagrams solution presents a large collection of predesigned cybersecurity vector stencils, cliparts, shapes, icons and connectors to help you succeed in designing professional and accurate Network Security Diagrams, Network Security Infographics to share knowledge about effective ways of networks protection with help of software and network security devices of different cyber security degrees, Network Plans for secure wireless network, Computer Security Diagrams to visually tell about amazing possibilities of IT security solutions. The samples and examples reflect the power of ConceptDraw PRO software in drawing Network Security Diagrams, give the representation about variety of existing types of attacks and threats, help to realize their seriousness and the methods to deal with them.
 Network Layout Floor Plans
Network Layout Floor Plans solution extends ConceptDraw PRO software functionality with powerful tools for quick and efficient documentation the network equipment and displaying its location on the professionally designed Network Layout Floor Plans. Never before creation of Network Layout Floor Plans, Network Communication Plans, Network Topologies Plans and Network Topology Maps was not so easy, convenient and fast as with predesigned templates, samples, examples and comprehensive set of vector design elements included to the Network Layout Floor Plans solution. All listed types of plans will be a good support for the future correct cabling and installation of network equipment.
Product Overview

ConceptDraw Solution Park
ConceptDraw Solution Park collects graphic extensions, examples and learning materials
 Venn Diagrams
Venn Diagrams are actively used to illustrate simple set relationships in set theory and probability theory, logic and statistics, mathematics and computer science, linguistics, sociology, and marketing. Venn Diagrams are also often used to visually summarize the status and future viability of a project.
- How to Create a Timeline Diagram in ConceptDraw PRO | Timeline ...
- Timeline Diagrams | How to Create a Timeline Diagram in ...
- How to Create a Timeline Diagram in ConceptDraw PRO | How to ...
- Timeline Diagrams | How to Create a Timeline Diagram in ...
- Marketing Plan Infographic | Social Media Marketing Infographic ...
- Timeline Diagrams | Timeline Examples | How to Make a Timeline ...
- 25 Typical Orgcharts | Egypt timeline of communication shutdown ...
- ConceptDraw Solution Park | How to Create a Social Media DFD ...
- Geo Map - Africa - Egypt | Egypt timeline of communication ...
- Basic Flowchart Symbols and Meaning | How to Create a Timeline ...
- Windows 8 apps - Vector stencils library | Accounting Flowcharts ...
- SmartAmerica Challenge - Timeline | Learn how to create a current ...
- Basic Flowchart Symbols and Meaning | Process Flowchart | How to ...
- Concept Evaluation Characteristics Of Internet Diagrams
- Cisco Products Additional. Cisco icons, shapes, stencils and symbols
- Timeline To Launch Example
- Internet Connectivity. Computer and Network Examples | 3D Column ...
- Basic Flowchart Symbols and Meaning | How to Create a Timeline ...
- Online Diagram Tool | UML Component Diagram Example - Online ...
- Components of ER Diagram | Project timeline diagram - New ...
- ERD | Entity Relationship Diagrams, ERD Software for Mac and Win
- Flowchart | Basic Flowchart Symbols and Meaning
- Flowchart | Flowchart Design - Symbols, Shapes, Stencils and Icons
- Flowchart | Flow Chart Symbols
- Electrical | Electrical Drawing - Wiring and Circuits Schematics
- Flowchart | Common Flowchart Symbols
- Flowchart | Common Flowchart Symbols