The Best Flowchart Software Available

ConceptDraw PRO vector diagramming and business graphics software enhanced with with templates, green and interactive flowchart makers, samples and stencil libraries from ConceptDraw Solution Park which all focused to help with drawing flowcharts, block diagrams, bar charts, histograms, pie charts, divided bar diagrams, line graphs, area charts, scatter plots, circular arrows diagrams, Venn diagrams, bubble diagrams, concept maps, and others.

"Online advertising, also called Internet advertising, uses the Internet to deliver promotional marketing messages to consumers. It includes email marketing, search engine marketing, social media marketing, many types of display advertising (including web banner advertising), and mobile advertising. Like other advertising media, online advertising frequently involves both a publisher, who integrates advertisements into its online content, and an advertiser, who provides the advertisements to be displayed on the publisher's content. Other potential participants include advertising agencies who help generate and place the ad copy, an ad server who technologically delivers the ad and tracks statistics, and advertising affiliates who do independent promotional work for the advertiser." [Online advertising. Wikipedia]
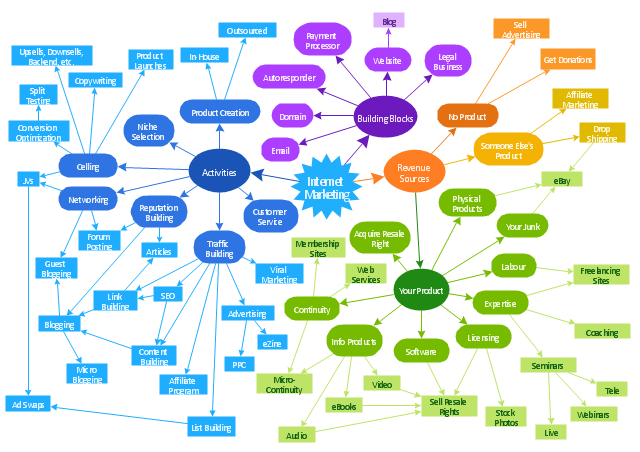
The concept map example "Internet marketing" was created using the ConceptDraw PRO diagramming and vector drawing software extended with the Concept Maps solution from the area "What is a Diagram" of ConceptDraw Solution Park.
The concept map example "Internet marketing" was created using the ConceptDraw PRO diagramming and vector drawing software extended with the Concept Maps solution from the area "What is a Diagram" of ConceptDraw Solution Park.
Concept map
 Continent Maps
Continent Maps solution extends ConceptDraw PRO software with templates, samples and libraries of vector stencils for drawing the thematic maps of continents, state maps of USA and Australia.
 Australia Map
For graphic artists creating accurate maps of Australia. The Australia Map solution - allows designers to map Australia for their needs, offers a collection of scalable graphics representing the political geography of Australia, split into distinct state
 UK Map
The Map of UK solution contains collection of professionally designed samples and scalable vector stencil graphics maps, representing the United Kingdom counties, regions and cities. Use the Map of UK solution from ConceptDraw Solution Park as the base fo
Spatial infographics Design Elements: Continental Map

How To Create a Flow Chart in ConceptDraw

Put an initial object from library to a page and use RapidDraw technology clicking on direction arrows to add new objects to the flowchart. This way you can make flowchart quickly.
Best Diagramming Software for macOS


Venn Diagram

 Education Package
Education Package is a comprehensive set of multifarious graphical solutions from ConceptDraw Solution Park, collected together in help to ConceptDraw PRO users working in a field of science, education and training, which is aimed at improving the quality of education and helping to design with ease variety of interesting and colorful educational materials, diagrams, charts and maps. Use it to present the information and knowledge in an interesting, clear, structured and simple form to achieve a success in education and pedagogy, to maintain the interest of students and pupils throughout the whole learning process, at the lectures, lessons and even during independent work with additional materials, to contribute to better perception of scientific information by listeners during the conferences and reports.
Best Diagramming

HelpDesk
How to Draw a Circular Arrows Diagram Using ConceptDraw PRO

Mind Map Making Software

 Divided Bar Diagrams
The Divided Bar Diagrams Solution extends the capabilities of ConceptDraw PRO v10 with templates, samples, and a library of vector stencils for drawing high impact and professional Divided Bar Diagrams and Graphs, Bar Diagram Math, and Stacked Graph.
Pie Chart Examples and Templates

Pie chart examples and templates created using ConceptDraw PRO software helps you get closer with pie charts and find pie chart examples suite your needs.
- Examples Of Statistics Concept Map
- Concept Map Of Statistic
- Internet marketing - Concept map
- Concept Map Of Marketing
- Internet marketing - Concept map | What Is a Concept Map | Leaky ...
- Online shop - Concept map | Concept Map | Internet marketing ...
- What Is a Concept Map | Internet marketing - Concept map | Internet ...
- Concept Maps | Venn Diagram Examples for Problem Solving ...
- Internet Marketing Infographic | Internet marketing professions ...
- Concept Maps | Basic Flowchart Symbols and Meaning | Basic ...
- Concept Maps | Concept Mapping | The Best Flowchart Software ...
- Concept Mapping For Maths
- Internet marketing - Concept map | What Is a Concept Map | The ...
- Internet marketing - Concept map | Leaky bucket diagram | What Is a ...
- Internet marketing - Concept map | What Is a Concept Map ...
- Internet marketing - Concept map | Flowchart Marketing Process ...
- Concept Map Mathematics
- Statistics Map Template
- Basic Diagramming | Concept Maps | Mathematics | Concept ...
- Concept Maps | Internet marketing professions | Concept Maps ...
- ERD | Entity Relationship Diagrams, ERD Software for Mac and Win
- Flowchart | Basic Flowchart Symbols and Meaning
- Flowchart | Flowchart Design - Symbols, Shapes, Stencils and Icons
- Flowchart | Flow Chart Symbols
- Electrical | Electrical Drawing - Wiring and Circuits Schematics
- Flowchart | Common Flowchart Symbols
- Flowchart | Common Flowchart Symbols