PDPC

"Process Decision Program Chart (PDPC).
A useful way of planning is to break down tasks into a hierarchy, using a tree diagram. The PDPC extends the tree diagram a couple of levels to identify risks and countermeasures for the bottom level tasks. Different shaped boxes are used to highlight risks and identify possible countermeasures (often shown as 'clouds' to indicate their uncertain nature). The PDPC is similar to the Failure Modes and Effects Analysis (FMEA) in that both identify risks, consequences of failure, and contingency actions; the FMEA also rates relative risk levels for each potential failure point." [Seven Management and Planning Tools. Wikipedia]
The Risk diagram (process decision program chart, PDPC) determines the risks when corrective action is not performed correctly. Also, it helps develop descriptions for preventive actions at the level of execution.
The Risk diagram (PDPC) template for the ConceptDraw PRO diagramming and vector drawing software is included in the solution "Seven Management and Planning Tools" from the Management area of ConceptDraw Solution Park.
Risk diagram
---template.png--diagram-flowchart-example.png)
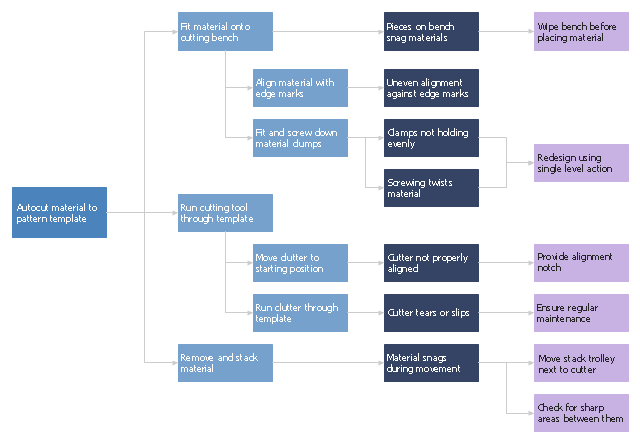
"Process Decision Program Chart (PDPC) is a technique designed to help prepare contingency plans. The emphasis of the PDPC is to identify the consequential impact of failure on activity plans, and create appropriate contingency plans to limit risks. Process diagrams and planning tree diagrams are extended by a couple of levels when the PDPC is applied to the bottom level tasks on those diagrams. ...
From the bottom level of some activity box, the PDPC adds levels for:
(1) identifying what can go wrong (failure mode or risks);
(2) consequences of that failure (effect or consequence);
(3) possible countermeasures (risk mitigation action plan)." [Process decision program chart. Wikipedia]
The process decision program chart (PDPC) example "Personal activity" was created using the ConceptDraw PRO diagramming and vector drawing software extended with the solution "Seven Management and Planning Tools" from the Management area of ConceptDraw Solution Park.
PDPC
---personal-activity.png--diagram-flowchart-example.png)
HelpDesk
How To Create Risk Diagram (PDPC) Using Solutions

CORRECTIVE ACTIONS PLANNING. Risk Diagram (PDPC)
 *")

"Waste minimization is the process and the policy of reducing the amount of waste produced by a person or a society.
Waste minimization involves efforts to minimize resource and energy use during manufacture. For the same commercial output, usually the fewer materials are used, the less waste is produced. Waste minimization usually requires knowledge of the production process, cradle-to-grave analysis (the tracking of materials from their extraction to their return to earth) and detailed knowledge of the composition of the waste. ...
In the waste hierarchy, the most effective approaches to managing waste are at the top. In contrast to waste minimisation, waste management focuses on processing waste after it is created, concentrating on re-use, recycling, and waste-to-energy conversion." [Waste minimisation. Wikipedia]
The process decision program chart (PDPC) example "Minimization of material wastage" was created using the ConceptDraw PRO diagramming and vector drawing software extended with the solution "Seven Management and Planning Tools" from the Management area of ConceptDraw Solution Park.
PDPC
Decision Making

The Seven Management and Planning Tools is a set for such diagrams: Affinity Diagram, Relations Diagram, Prioritization Matrix, Root Cause Tree Diagram, Involvement Matrix, PERT Chart, Risk Diagram (PDPC).
Cause and Effect Analysis

Preventive Action

Skilled use of these diagrams makes collaborative teamwork both more engaging and more effective.
The Action Plan

ConceptDraw Office suite is a software for decision making and action plan.
Presentations in Educational Process


Risk Diagram (Process Decision Program Chart)
 *")
PROBLEM ANALYSIS. Root Cause Analysis Tree Diagram

ConceptDraw Office suite is a software for problem analysis.
"Chronic care management encompasses the oversight and education activities conducted by health care professionals to help patients with chronic diseases and health conditions such as diabetes, high blood pressure, lupus, multiple sclerosis and sleep apnea learn to understand their condition and live successfully with it. This term is equivalent to disease management (health) for chronic conditions. The work involves motivating patients to persist in necessary therapies and interventions and helping them to achieve an ongoing, reasonable quality of life." [Chronic care management. Wikipedia]
The health care risk diagram (process decision program chart, PDPC) example "Chronic care improvement" was created using the ConceptDraw PRO diagramming and vector drawing software extended with the solution "Seven Management and Planning Tools" from the Management area of ConceptDraw Solution Park.
The health care risk diagram (process decision program chart, PDPC) example "Chronic care improvement" was created using the ConceptDraw PRO diagramming and vector drawing software extended with the solution "Seven Management and Planning Tools" from the Management area of ConceptDraw Solution Park.
Risk diagram
.png--diagram-flowchart-example.png)
Risk Diagram (Process Decision Program Chart)
 *")
The PDPC determines the risks when corrective action is not performed correctly. Also, it helps develop descriptions for preventive actions at the level of execution.
Corrective Action Planning

Corrective action planning define people and groups involvement in corrective actions by roles, identify logical sequences of scheduled actions and critical path of problem solving, identify possible risks of action plan and propose preventive actions.
Scatter Chart Analysis. Scatter Chart Example

Why Flowchart Important to Accounting Information System?

Flowcharts are used to represent accounting information in a system. There are special symbols which are used to create accounting flowcharts. Try conceptdraw flowcharting set of symbols to draw a professional charts.
Problem solving

These tools are exemplary at organizing research, parsing complex problems, providing a structure for the details, helping managers make decisions, and organizing effective communications in a visual manner that keeps everyone involved.
Risk Analysis

- PDPC | Risk diagram ( PDPC ) - Template | Process decision ...
- Process decision program chart ( PDPC ) - Personal activity | Process ...
- PDPC | Process decision program chart ( PDPC ) - Personal activity ...
- Types of Flowcharts | Process decision program chart ( PDPC ...
- Process decision program chart ( PDPC ) - Personal activity | Risk ...
- PDPC | Risk diagram ( PDPC ) - Template | Preventive Action | Pdpc ...
- How To Create Risk Diagram ( PDPC )
- Risk diagram ( PDPC ) - Template | PDPC | Preventive Action ...
- PDPC | Prioritization Matrix | Total Quality Management Density ...
- PDPC | Fault Tree Analysis Diagrams | Process Flowchart | Free ...
- CORRECTIVE ACTIONS PLANNING. Risk Diagram ( PDPC ) | How ...
- Process decision program chart ( PDPC ) - Personal activity ...
- Process decision program chart ( PDPC ) - Personal activity
- How To Create Risk Diagram ( PDPC ) Using Solutions | Risk ...
- Risk Diagram (Process Decision Program Chart) | Process decision ...
- Basic Flowchart Symbols and Meaning | CORRECTIVE ACTIONS ...
- Risk diagram ( PDPC ) - Template | Process decision program chart ...
- CORRECTIVE ACTIONS PLANNING. Risk Diagram ( PDPC ...
- Risk diagram ( PDPC ) - Template | TQM diagram - Template | UML ...
- PDPC | Functional Flow Block Diagram | Risk diagram ( PDPC ...
- ERD | Entity Relationship Diagrams, ERD Software for Mac and Win
- Flowchart | Basic Flowchart Symbols and Meaning
- Flowchart | Flowchart Design - Symbols, Shapes, Stencils and Icons
- Flowchart | Flow Chart Symbols
- Electrical | Electrical Drawing - Wiring and Circuits Schematics
- Flowchart | Common Flowchart Symbols
- Flowchart | Common Flowchart Symbols