KPI Dashboard

A KPI Dashboard

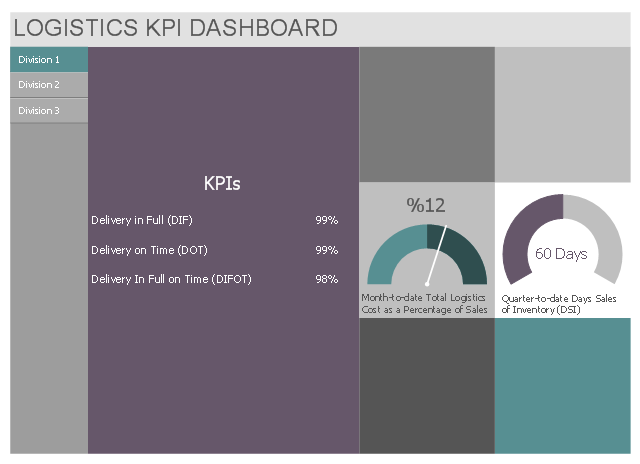
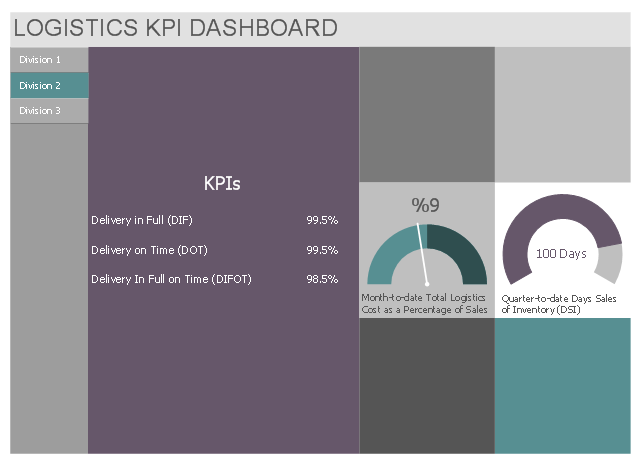
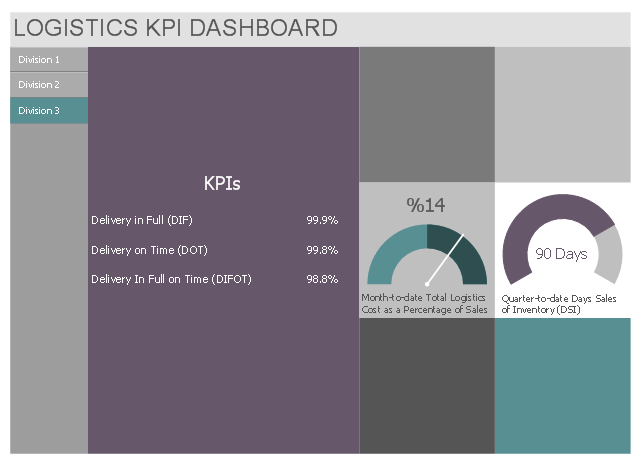
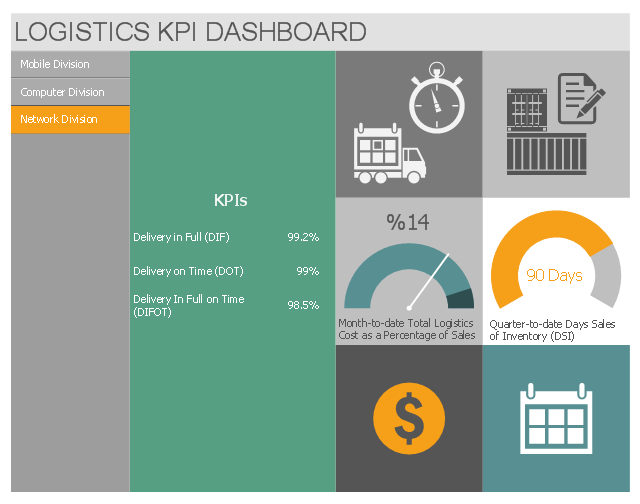
This multipage business dashboard template contains navigation vertical menu and graphic indicators of logistic key performance indicators (KPIs) and business metrics.
Use it to create your logistic KPI dashboard with ConceptDraw PRO software.
The performance dashboard template "Logistics KPI Dashboard" is included in Logistic Dashboard solution from Business Processes area of ConceptDraw Solution Park.
Use it to create your logistic KPI dashboard with ConceptDraw PRO software.
The performance dashboard template "Logistics KPI Dashboard" is included in Logistic Dashboard solution from Business Processes area of ConceptDraw Solution Park.
Division 1
Division 2
Division 3
What is a KPI?
ConceptDraw DIAGRAM diagramming and vector drawing software enhanced with Sales Dashboard solution from the Marketing area of ConceptDraw Solution Park allows effectively develop, analyze and improve your business thanks to the excellent possibility of monitoring all KPIs on one screen in a real time.
A KPI Dashboard Provides the Answers Your Sales Team

This multipage business dashboard example shows navigation vertical menu and graphic indicators of logistic key performance indicators (KPIs) and business metrics.
"A performance indicator or key performance indicator (KPI) is a type of performance measurement. KPIs evaluate the success of an organization or of a particular activity in which it engages. Often success is simply the repeated, periodic achievement of some levels of operational goal..., and sometimes success is defined in terms of making progress toward strategic goals. Accordingly, choosing the right KPIs relies upon a good understanding of what is important to the organization." [Performance indicator. Wikipedia]
The performance dashboard example "Logistics KPI Dashboard" was designed using ConceptDraw PRO software extended with Logistic Dashboard solution from Business Processes area of ConceptDraw Solution Park.
Mobile Division
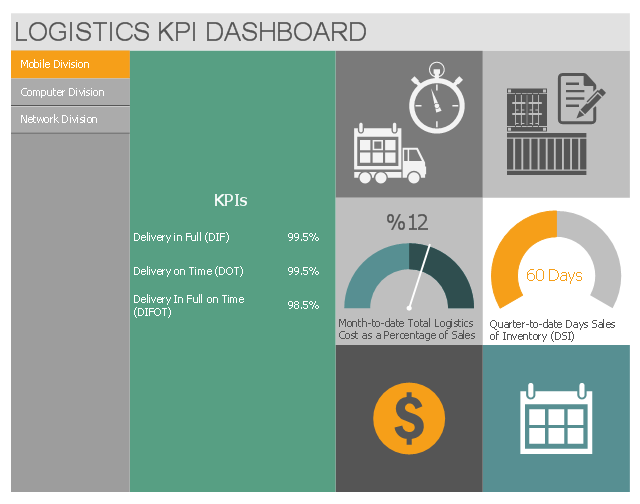
Computer Division
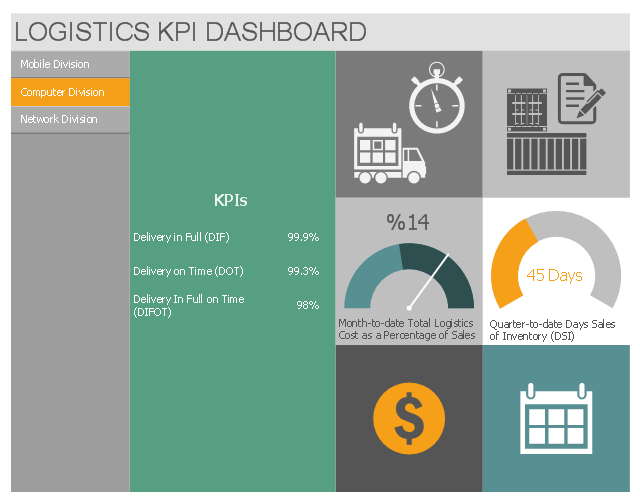
Network Division
KPIs and Metrics

Sales KPI Dashboards
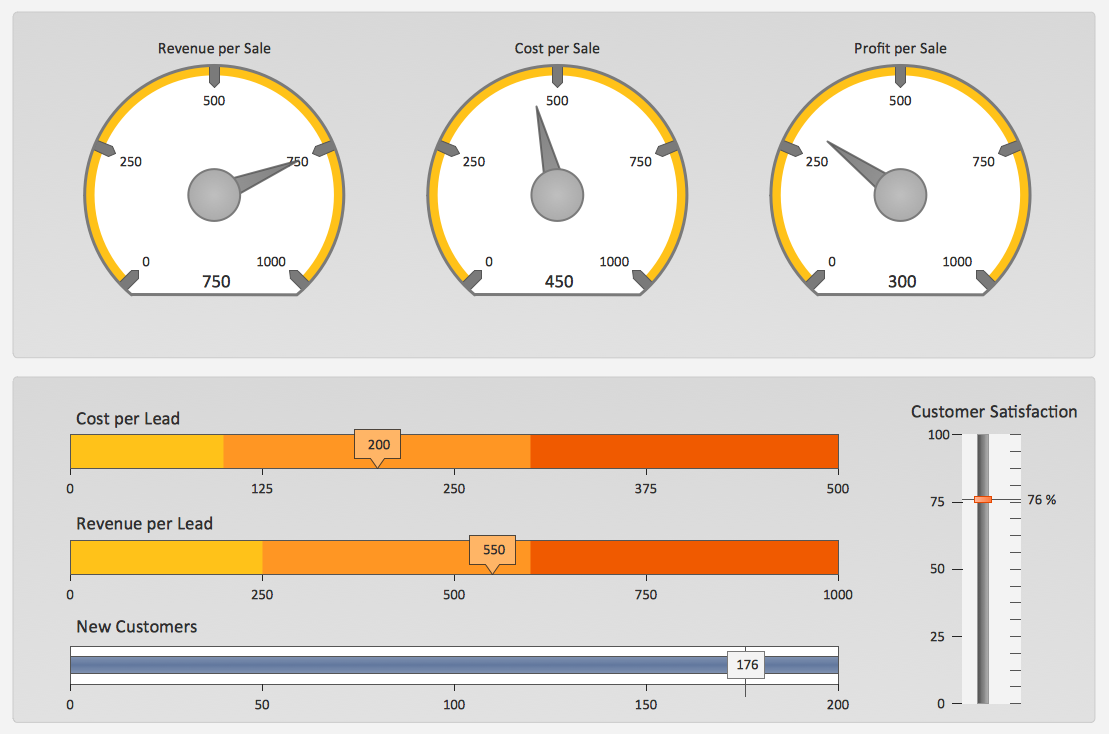
Sales Dashboard Solutions can help your sales team keep an eye on performance

Sales Dashboard Template

- PM Dashboards | A KPI Dashboard Provides the Answers Your ...
- KPI Dashboard | Sales Dashboard | Performance Indicators | Key ...
- KPIs and Metrics | The Facts and KPIs | A KPI Dashboard | After ...
- Kpi Dashboard Examples
- Sales Dashboard Template | KPI Dashboard | KPIs and Metrics | Ppt ...
- KPIs and Metrics | A KPI Dashboard | Sales KPI Dashboards ...
- Visualization Of Kpi Ppt
- Sales KPI Dashboards | What is a KPI ? | The Facts and KPIs | Kpi ...
- Sales Dashboards for Your Company | A KPI Dashboard | The Facts ...
- KPIs and Metrics | Sales KPI Dashboards | A KPI Dashboard ...
- ERD | Entity Relationship Diagrams, ERD Software for Mac and Win
- Flowchart | Basic Flowchart Symbols and Meaning
- Flowchart | Flowchart Design - Symbols, Shapes, Stencils and Icons
- Flowchart | Flow Chart Symbols
- Electrical | Electrical Drawing - Wiring and Circuits Schematics
- Flowchart | Common Flowchart Symbols
- Flowchart | Common Flowchart Symbols