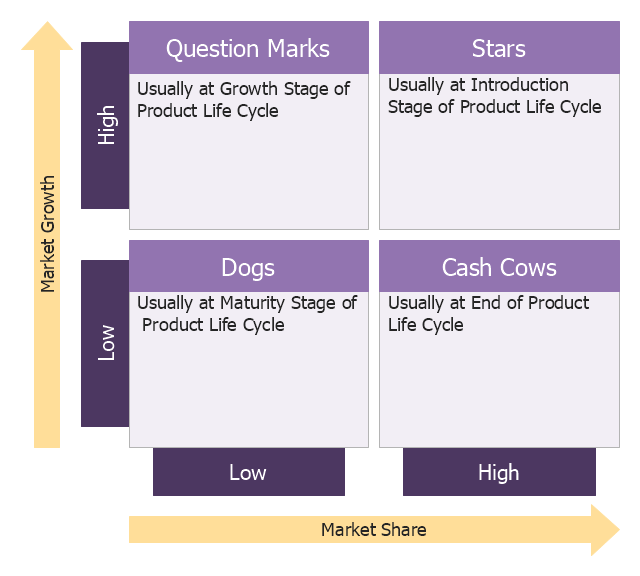
BCG Matrix helps to allocate resources, and it's used in brand marketing, product and strategic management, portfolio analysis. It assumes that an increase in relative market share will result in an increase in the cash generation, and that a growing market requires investment in assets to increase capacity and results in the cash consumption. The position of a business on the matrix provides an indication of its cash generation and consumption. The 4 categories are: Dogs; Question marks; Stars; Cash cows. The matrix is also used for resource allocation among products in a single business unit: the relative positions of the firm's business portfolio are displayed in a single diagram.
The template "Boston growth-share matrix" for the ConceptDraw PRO diagramming and vector drawing software is included in the Matrices solution from the Marketing area of ConceptDraw Solution Park.
The template "Boston growth-share matrix" for the ConceptDraw PRO diagramming and vector drawing software is included in the Matrices solution from the Marketing area of ConceptDraw Solution Park.
Boston growth share matrix template
BCG Matrix

"The growth–share matrix (aka the product portfolio, BCG-matrix, Boston matrix, Boston Consulting Group analysis, portfolio diagram) is a chart that was created by Bruce D. Henderson for the Boston Consulting Group in 1970 to help corporations to analyze their business units, that is, their product lines. This helps the company allocate resources and is used as an analytical tool in brand marketing, product management, strategic management, and portfolio analysis. ...
To use the chart, analysts plot a scatter graph to rank the business units (or products) on the basis of their relative market shares and growth rates.
Cash cows is where company has high market share in a slow-growing industry. ...
Dogs, more charitably called pets, are units with low market share in a mature, slow-growing industry. ...
Question marks (also known as problem children) are business operating in a high market growth, but having a low market share. ...
Stars are units with a high market share in a fast-growing industry." [Growth–share matrix. Wikipedia]
This Boston growth-share (BCG) matrix diagram example was created using the ConceptDraw PRO diagramming and vector drawing software extended with the Matrices solution from the Marketing area of ConceptDraw Solution Park.
BCG Matrix
-matrix-diagram.png--diagram-flowchart-example.png)
Geo Map - USA - Massachusetts

The vector stencils library Massachusetts contains contours for ConceptDraw DIAGRAM diagramming and vector drawing software. This library is contained in the Continent Maps solution from Maps area of ConceptDraw Solution Park.
Growth-Share Matrix Software

The Matrices Solution also provides a wide variety of templates and samples that will help you to create the Matrix diagrams of any difficulty.
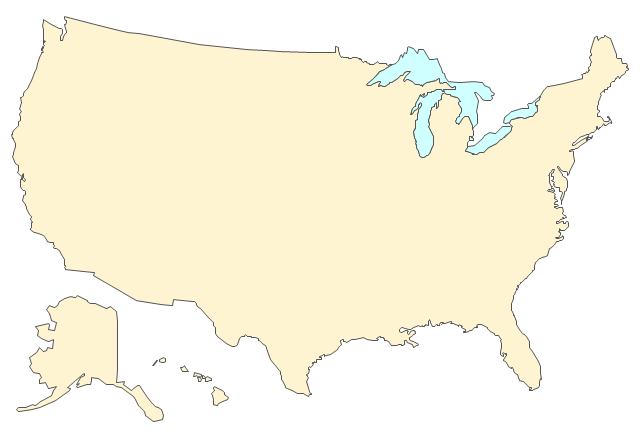
The vector stencils library "United States of America" contains 53 state map contours for drawing thematic maps of USA.
Use it for visual representation of geospatial information, statistics and quantitative data.
The state map contours example "United States of America - Vector stencils library" was created using the ConceptDraw PRO diagramming and vector drawing software extended with the Continent Maps solution from the Maps area of ConceptDraw Solution Park.
USA (color)
-united-states-of-america---vector-stencils-library.png--diagram-flowchart-example.png)
USA
Alabama
Alaska
Arizona
Arkansas
California
Colorado

Connecticut
Delaware
Florida
Georgia

Hawaii
Idaho

Illinois

Indiana

Iowa
Kansas

Kentucky
Louisiana
Maine
Maryland
Massachusetts
Michigan
Minnesota
Mississippi

Missouri
Montana
Nebraska
Nevada

New Hampshire
New Jersey
New York
New Mexico
North Dakota

North Carolina
Ohio
Oklahoma
Oregon
Pennsylvania
Rhode Island
South Carolina
South Dakota

Tennessee
Texas
Utah
Vermont
Virginia
Washington
West Virginia
Wisconsin
Wyoming

Great Lakes
Bubble Plot

This sample shows the BCG (Boston Consulting Group) matrix that is used in marketing and product management for strategic analysis and planning.
 Matrices
This solution extends ConceptDraw DIAGRAM software with samples, templates and library of design elements for drawing the business matrix diagrams.
SWOT Analysis

Software for Creating SWOT Analysis Diagrams

What is SWOT Analysis?

How to Make SWOT Analysis in a Word Document

ConceptDraw products across any platform, meaning you never have to worry about compatibility again. ConceptDraw MINDMAP allows you to make SWOT analysis on PC or macOS operating systems.
Swot Analysis Examples

Mind Maps for Business - SWOT Analysis

SWOT Analysis Tool for Small Business

Swot Analysis Examples for Mac OSX

Mac Tools - SWOT Analysis

Business Productivity - Marketing

intelligent vector graphics that are useful for marketing diagramming and
ConceptDraw MINDMAP for key marketing mind maps.
SWOT Analysis Solution - Strategy Tools

SWOT analysis Software & Template for Macintosh and Windows

- Boston growth-share matrix - Template
- Boston growth-share matrix - Template | BCG Matrix | Growth-Share ...
- Boston growth-share (BCG) matrix diagram | Boston Consulting ...
- Boston growth-share (BCG) matrix diagram | Matrices | Example Of ...
- Boston growth-share (BCG) matrix diagram
- BCG Matrix | Swot Analysis Examples | SWOT Analysis matrix ...
- Boston growth-share (BCG) matrix diagram | Draw A Bcg Matrix In ...
- Bubble Plot | Matrices | Marketing Area | Boston Matrix Bubble ...
- Ansoff Matrix | BCG Matrix | Swot Analysis Examples | Boston Matrix ...
- Boston growth-share matrix - Template | Seven Management and ...
- BCG Matrix | Growth-Share Matrix Software | Matrices | Visio Boston ...
- BCG Matrix | Growth-Share Matrix Software | Matrix Organization ...
- Diagram Of Boston Consulting Matrix
- BCG Matrix | Growth-Share Matrix Software | Pyramid Diagram ...
- BCG Matrix | Ansoff Matrix | SWOT Analysis matrix templates and ...
- SWOT analysis positioning matrix - Template | Boston growth-share ...
- Marketing | Boston growth-share matrix - Template | Business ...
- BCG Matrix | Growth-Share Matrix Software | SWOT Sample in ...
- United States of America - Vector stencils library
- SWOT Matrix Template | Prioritization matrix - Template | TOWS ...
- ERD | Entity Relationship Diagrams, ERD Software for Mac and Win
- Flowchart | Basic Flowchart Symbols and Meaning
- Flowchart | Flowchart Design - Symbols, Shapes, Stencils and Icons
- Flowchart | Flow Chart Symbols
- Electrical | Electrical Drawing - Wiring and Circuits Schematics
- Flowchart | Common Flowchart Symbols
- Flowchart | Common Flowchart Symbols