This bubble diagram sample shows the visual representation of the McKinsey 7S framework model. It was redesigned from the Wikimedia Commons file: McKinsey 7S framework.svg.
[commons.wikimedia.org/ wiki/ File:McKinsey_ 7S_ framework.svg]
This file is licensed under the Creative Commons Attribution-Share Alike 3.0 Unported license. [creativecommons.org/ licenses/ by-sa/ 3.0/ deed.en]
"The McKinsey 7S Framework is a management model developed by well-known business consultants Robert H. Waterman, Jr. and Tom Peters ... in the 1980s. This was a strategic vision for groups, to include businesses, business units, and teams. The 7S are structure, strategy, systems, skills, style, staff and shared values.
The model is most often used as a tool to assess and monitor changes in the internal situation of an organization.
The model is based on the theory that, for an organization to perform well, these seven elements need to be aligned and mutually reinforcing. So, the model can be used to help identify what needs to be realigned to improve performance, or to maintain alignment (and performance) during other types of change." [McKinsey 7S Framework. Wikipedia]
The bubble diagram example "McKinsey 7S framework" was created using the ConceptDraw PRO diagramming and vector drawing software extended with the Bubble Diagrams solution from the area "What is a Diagram" of ConceptDraw Solution Park.
7 Continents Map
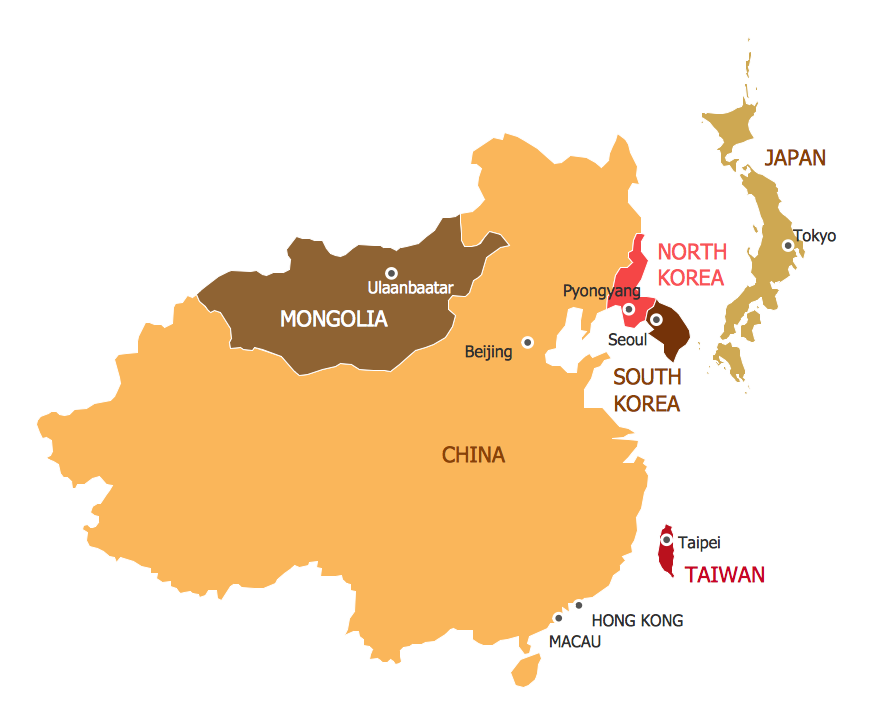
A continent is a large area of land washed by the seas. There are 7 continents on the Earth: Asia, Africa, North America, South America, Antarctica, Europe, and Australia. If you want create the 7 Continents Map, we offer you incredibly useful tool for this - ConceptDraw PRO diagramming and vector drawing software extended with Continent Maps Solution from the Maps Area of ConceptDraw Solution Park.Bubble Charts
Bubble Charts are convenient way to visualize ideas and concepts by organizing them in a hierarchy. To show the importance of ideas you can use different bubble sizes and colors. ConceptDraw PRO diagramming and vector drawing software extended with Bubble Diagrams Solution from the "What is a Diagram" Area affords you the easiest and fastest way for designing professional looking Bubble Charts.7 Management & Planning Tools
The "7 Management and Planning Tools" solution implements well-known methodologies for problem analysis and solving. Different products from the ConceptDraw Office suite can be used as a complete solution for any of the methodologies in this solution. ConceptDraw Office provides visual communication during every stage of work.
 Seven Management and Planning Tools
Seven Management and Planning Tools solution extends ConceptDraw PRO and ConceptDraw MINDMAP with features, templates, samples and libraries of vector stencils for drawing management mind maps and diagrams.
HelpDesk
Downloading the Old Versions of ConceptDraw Products
These are the last updates that were released for the previous versions of ConceptDraw products.PROBLEM ANALYSIS. Root Cause Analysis Tree Diagram
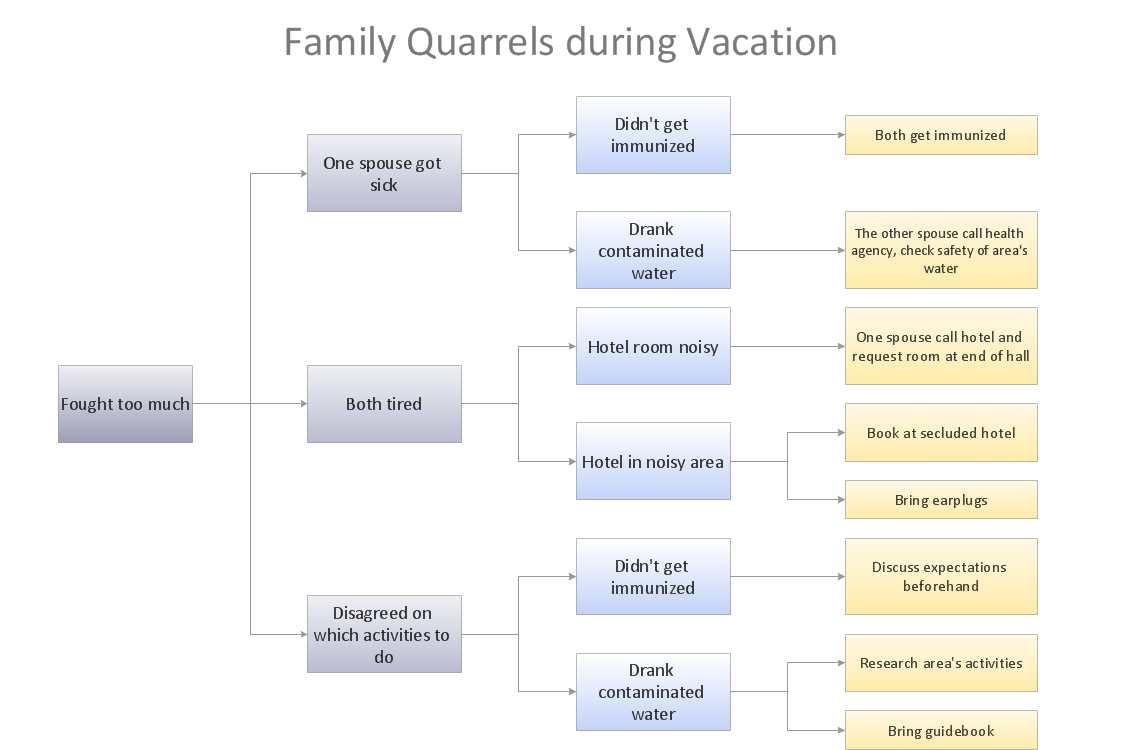
Root Cause Analysis Tree Diagram. Use the Root Cause Diagram to perform visual root cause analysis. Root Cause Analysis Tree Diagram is constructed separately for each highly prioritized factor. The goal of this is to find the root causes for the factor and list possible corrective action.ConceptDraw Office suite is a software for problem analysis.

PROBLEM ANALYSIS. Prioritization Matrix
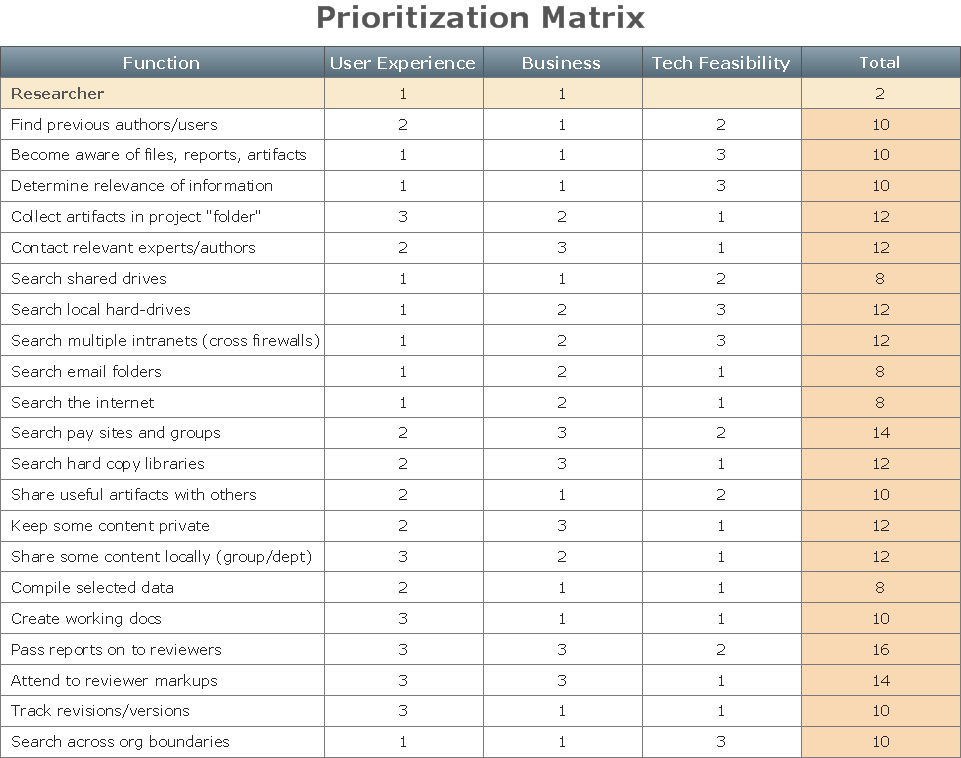
ConceptDraw Office suite is a software for Prioritization Matrix diagram making. This diagram ranks the drivers’ factors to determine priority. It identifies the factors of the first priority for analysis of possible corrective actions. It assesses the weight of each factor for each criterion and specifies it in the Prioritization Matrix. The total sum of weights for a factor’s criteria indicates its priority.
"Causes in the diagram are often categorized, such as to the 6 M's ...
The 6 Ms (used in manufacturing industry):
(1) Machine (technology);
(2) Method (process);
(3) Material (Includes Raw Material, Consumables and Information.);
(4) Man Power (physical work)/ Mind Power (brain work): Kaizens, Suggestions;
(5) Measurement (Inspection);
(6) Milieu/ Mother Nature (Environment).
The original 6Ms used by the Toyota Production System have been expanded by some to include the following and are referred to as the 8Ms. However, this is not globally recognized. It has been suggested to return to the roots of the tools and to keep the teaching simple while recognizing the original intent; most programs do not address the 8Ms.
(7) Management/ Money Power;
(8) Maintenance." [Ishikawa diagram. Wikipedia]
This 8Ms Ishikawa diagram (manufacturing cause and effect diagram) template is included in the Fishbone Diagram solution from the Management area of ConceptDraw Solution Park.
Problem solving
Problem Solving - ConceptDraw Office suite is a software for the problem solving. The Seven Management and Planning Tools solution is a set of such tools for investigating complex problems.These tools are exemplary at organizing research, parsing complex problems, providing a structure for the details, helping managers make decisions, and organizing effective communications in a visual manner that keeps everyone involved.

Cause and Effect Analysis
Cause and Effect Analysis - The Seven Management and Planning Tools is a tool for Cause and Effect Analysis that allows users to analyze the root causes for factors that influenced the problem. This diagram is constructed separately for each highly prioritized factor. The Diagram is then used for further formulation of potential actions.
Corrective Action Planning
One of the stages of the problem's solving process scenario is Corrective Action Planning.Corrective action planning define people and groups involvement in corrective actions by roles, identify logical sequences of scheduled actions and critical path of problem solving, identify possible risks of action plan and propose preventive actions.

Preventive Action
Preventive Action - ConceptDraw Office suite is a software for the Preventive Action making. The Seven Management and Planning Tools solution is a set of such tools for problems preventive actions via investigating of the core problem.Skilled use of these diagrams makes collaborative teamwork both more engaging and more effective.

PROBLEM ANALYSIS. Identify and Structure Factors
Identify and Structure Factors. Use the Affinity Diagram to collect and structure factors that impact on a problem.ConceptDraw Office suite is a software for identify and structure factors with affinity diagram. This is a grouping and structuring of factors that impact on a problem.

- McKinsey 7S framework - Bubble diagram | Bubble Charts | Bubble ...
- McKinsey 7S framework | Bubble Charts | Bubble Diagrams | 7s ...
- McKinsey 7S framework | Bubble Diagrams | Mckinsey Wikipedia
- McKinsey 7S framework - Bubble diagram | Global cumulative ...
- McKinsey 7S framework | 7 Management & Planning Tools | Bubble ...
- McKinsey 7S framework | Mckinsey 7s Wiki
- McKinsey 7S framework | Bubble Charts | Bubble Diagrams ...
- McKinsey 7S framework - Bubble diagram | Bubble Chart | Bubble ...
- McKinsey 7S framework
- 7 Tools For Quality Example
- Conceptdraw.com: Mind Map Software, Drawing Tools | Project ...
- 7 Management & Planning Tools | Corrective Action Planning | The ...
- 7 Continents Map | Continent Maps | Informative and Well-Designed ...
- Seven Management and Planning Tools | 7 Management ...
- 7 Continents Map | World Continents Map | Continents Map ...
- 7 Management & Planning Tools | PROBLEM ANALYSIS. Identify ...
- 7 Management & Planning Tools | Seven Management and ...
- 7 Continents Map
- 7 Continents Map | Map of Continents | World Continents Map ...
- 7 Continents Map | World Continents Map | Spatial infographics ...
- ERD | Entity Relationship Diagrams, ERD Software for Mac and Win
- Flowchart | Basic Flowchart Symbols and Meaning
- Flowchart | Flowchart Design - Symbols, Shapes, Stencils and Icons
- Flowchart | Flow Chart Symbols
- Electrical | Electrical Drawing - Wiring and Circuits Schematics
- Flowchart | Common Flowchart Symbols
- Flowchart | Common Flowchart Symbols


