The vector stencils library "Circular diagrams" contains 42 templates of circular diagrams: circular arrow diagram, circular motion diagram, arrow ring chart, doughnut chart (donut chart), circle pie chart, diamond pie chart, circle diagram, pie chart, ring chart, loop diagram, block loop diagram, arrow loop circle, crystal diagram, triangular diagram, diamond diagram, pentagon diagram, hexagon diagram, heptagon diagram, cycle diagram (cycle chart), stacked Venn diagram (onion diagram), arrow circle diagram.
Use these shapes to illustrate your marketing and sales documents, presentations, webpages and infographics in the ConceptDraw PRO diagramming and vector drawing software extended with the Target and Circular Diagrams solution from the Marketing area of ConceptDraw Solution Park.
www.conceptdraw.com/ solution-park/ marketing-target-and-circular-diagrams
Circular arrow diagram 1
Circular arrow diagram 2
Arrow ring chart
Doughnut chart

Diamond pie chart

Pie chart

Circle diagram

Circle pie chart 2

Circle pie chart 1

Ring chart 1 - 3 elements

Ring chart 1 - 4 elements

Ring chart 1 - 5 elements

Ring chart 1 - 6 elements

Ring chart 1 - 7 elements

Ring chart 2 - 3 elements

Ring chart 2 - 4 elements

Ring chart 2 - 5 elements

Ring chart 2 - 6 elements

Ring chart 2 - 7 elements

Crystal diagram - 3 elements

Crystal diagram - 4 elements

Crystal diagram - 5 elements

Crystal diagram - 6 elements

Crystal diagram - 7 elements

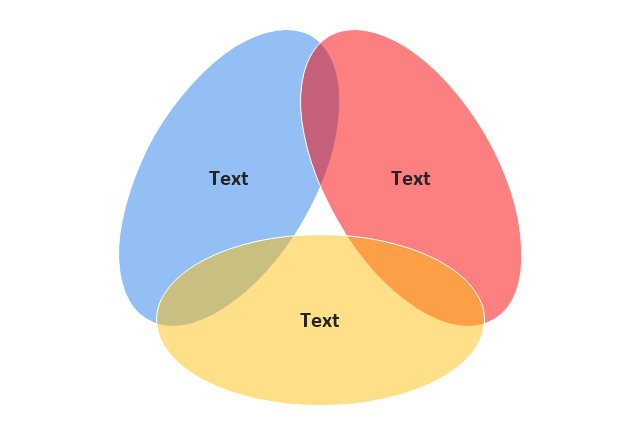
Stacked Venn diagram - 4

Stacked Venn diagram - 5

Stacked Venn diagram - 6

Stacked Venn diagram - 7

Basic loop diagram

Block loop diagram

Arrow loop circle
Arrow loop - 3 circles
Arrow loop - 4 circles
Arrow loop - 5 circles
Arrow loop - 6 circles
Arrow loop - 7 circles
Arrow circle diagram - 3
Arrow circle diagram - 4
Stacked Venn diagram - 3

Arrow circle diagram - 5
Arrow circle diagram - 6
Arrow circle diagram - 7
The vector stencils library "Circular diagrams" contains 42 templates of circular diagrams: circular arrow diagram, circular motion diagram, arrow ring chart, doughnut chart (donut chart), circle pie chart, diamond pie chart, circle diagram, pie chart, ring chart, loop diagram, block loop diagram, arrow loop circle, crystal diagram, triangular diagram, diamond diagram, pentagon diagram, hexagon diagram, heptagon diagram, cycle diagram (cycle chart), stacked Venn diagram (onion diagram), arrow circle diagram.
Use these shapes to illustrate your marketing and sales documents, presentations, webpages and infographics in the ConceptDraw PRO diagramming and vector drawing software extended with the Target and Circular Diagrams solution from the Marketing area of ConceptDraw Solution Park.
www.conceptdraw.com/ solution-park/ marketing-target-and-circular-diagrams
Use these shapes to illustrate your marketing and sales documents, presentations, webpages and infographics in the ConceptDraw PRO diagramming and vector drawing software extended with the Target and Circular Diagrams solution from the Marketing area of ConceptDraw Solution Park.
www.conceptdraw.com/ solution-park/ marketing-target-and-circular-diagrams
Circular arrow diagram 1
Circular arrow diagram 2
Arrow ring chart
Doughnut chart
Diamond pie chart
Pie chart
Circle diagram
Circle pie chart 2
Circle pie chart 1
Ring chart 1 - 3 elements
Ring chart 1 - 4 elements
Ring chart 1 - 5 elements
Ring chart 1 - 6 elements
Ring chart 1 - 7 elements
Ring chart 2 - 3 elements
Ring chart 2 - 4 elements
Ring chart 2 - 5 elements
Ring chart 2 - 6 elements
Ring chart 2 - 7 elements
Crystal diagram - 3 elements
Crystal diagram - 4 elements
Crystal diagram - 5 elements
Crystal diagram - 6 elements
Crystal diagram - 7 elements
Stacked Venn diagram - 4
Stacked Venn diagram - 5
Stacked Venn diagram - 6
Stacked Venn diagram - 7
Basic loop diagram
Block loop diagram
Arrow loop circle
Arrow loop - 3 circles
Arrow loop - 4 circles
Arrow loop - 5 circles
Arrow loop - 6 circles
Arrow loop - 7 circles
Arrow circle diagram - 3
Arrow circle diagram - 4
Stacked Venn diagram - 3
Arrow circle diagram - 5
Arrow circle diagram - 6
Arrow circle diagram - 7
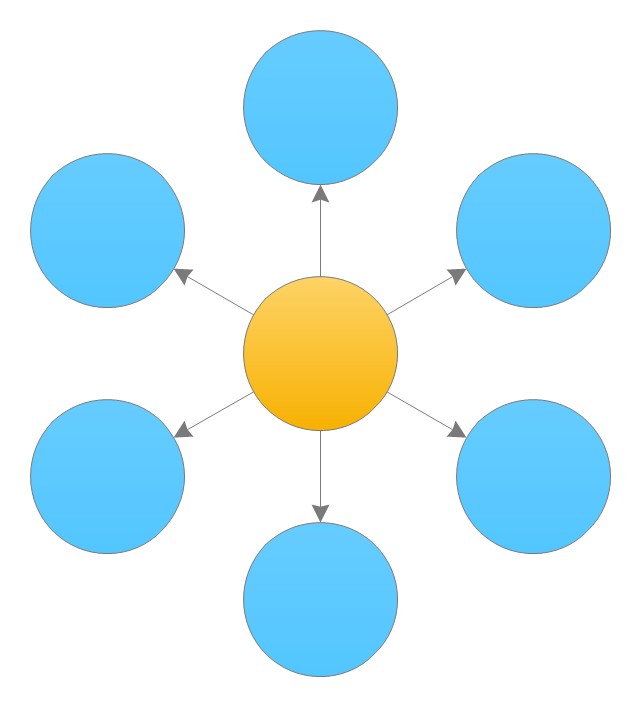
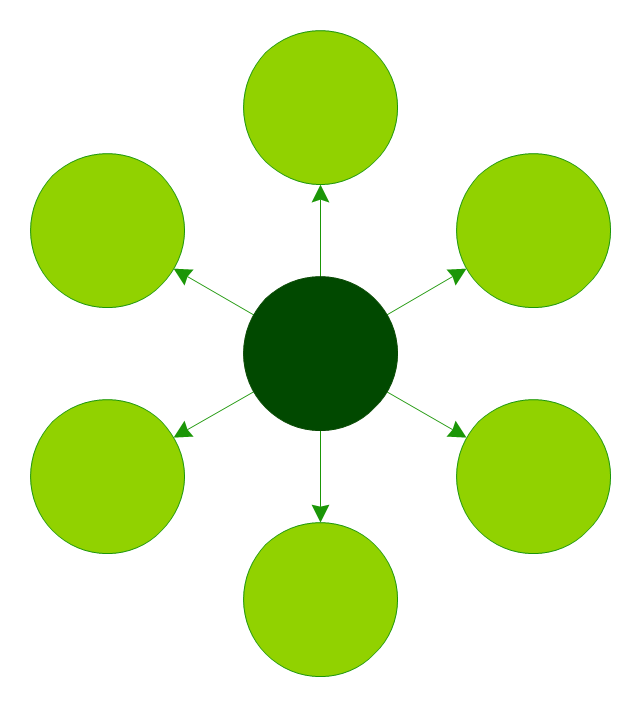
The vector stencils library "Circle-spoke diagram" contains 8 templates of circle-spoke diagrams.
Use these shapes to draw your circle spoke diagrams in the ConceptDraw PRO diagramming and vector drawing software extended with the Circle-Spoke Diagrams solution from the area "What is a Diagram" of ConceptDraw Solution Park.
Use these shapes to draw your circle spoke diagrams in the ConceptDraw PRO diagramming and vector drawing software extended with the Circle-Spoke Diagrams solution from the area "What is a Diagram" of ConceptDraw Solution Park.
Circle-Spoke Diagram 1
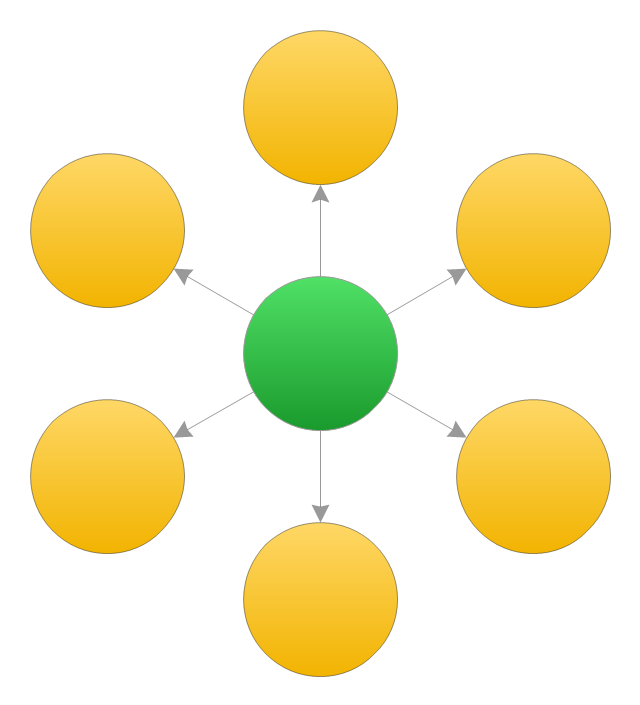
Circle-Spoke Diagram 2
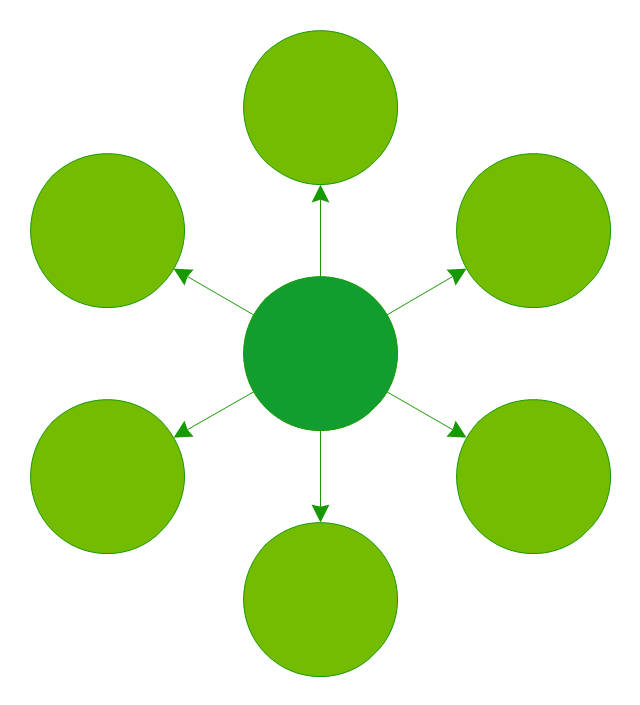
Circle-Spoke Diagram 3
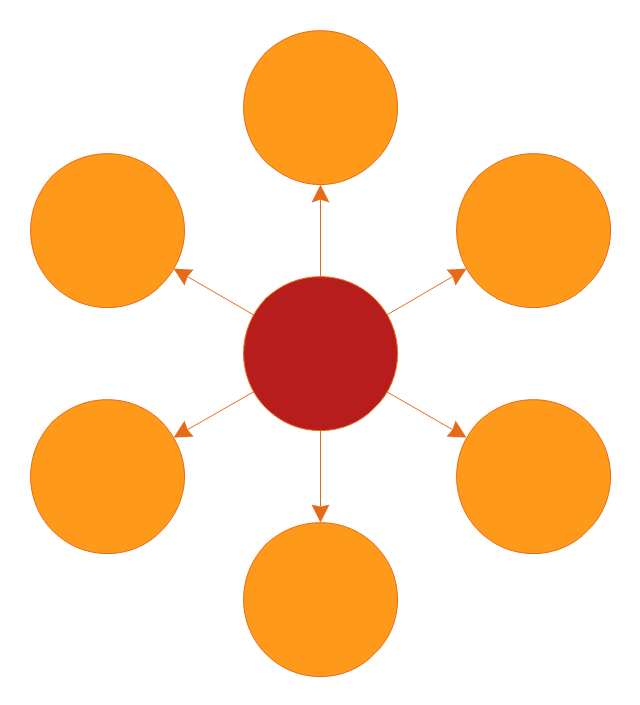
Circle-spoke diagram 4
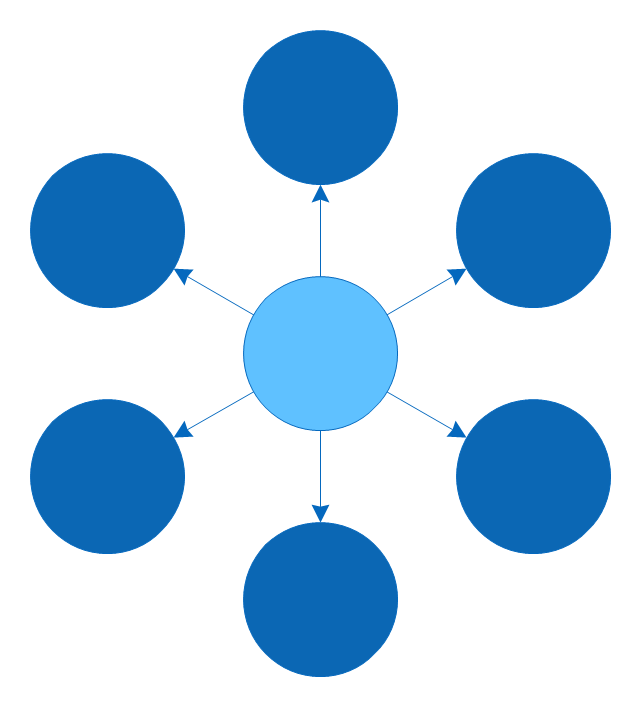
Circle-Spoke Diagram 5
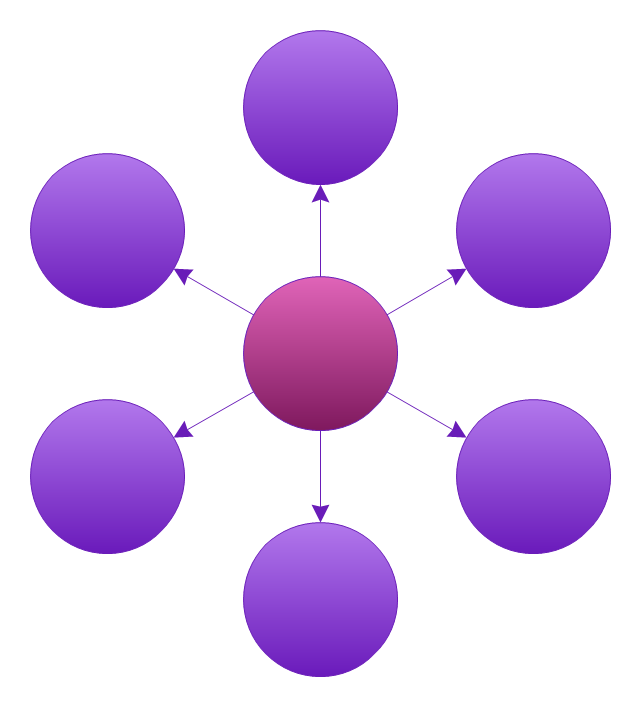
Circle-Spoke Diagram 6
Circle-Spoke Diagram 7
Circle-Spoke Diagram 8
The vector stencils library "Circular arrows diagrams" contains 20 templates of circular arrows diagrams and arrow donut charts.
Use these shapes to draw your circular arrows diagrams in the ConceptDraw PRO diagramming and vector drawing software.
The vector stencils library "Circular arrows diagrams" is included in the Circular Arrows Diagrams solution from the area "What is a Diagram" of ConceptDraw Solution Park.
Use these shapes to draw your circular arrows diagrams in the ConceptDraw PRO diagramming and vector drawing software.
The vector stencils library "Circular arrows diagrams" is included in the Circular Arrows Diagrams solution from the area "What is a Diagram" of ConceptDraw Solution Park.
Circular arrows diagram - 3 elements

Circular arrows diagram - 4 elements

Circular arrows diagram - 5 elements

Circular arrows diagram - 6 elements

Circular arrows diagram - 7 elements

Arrows donut chart - 3 slices

Arrows donut chart - 4 slices

Arrows donut chart - 5 slices

Arrows donut chart - 6 slices

Arrows donut chart - 7 slices

Ring chart - 3 elements

Ring chart - 4 elements

Ring chart - 5 elements

Ring chart - 6 elements

Ring chart - 7 elements

Arrow circle diagram - 3 elements
Arrow circle diagram - 4 elements
Arrow circle diagram - 5 elements
Arrow circle diagram - 6 elements
Arrow circle diagram - 7 elements
The vector stencils library "Circle-spoke diagram" contains 8 templates of circle-spoke diagrams.
Use these shapes to draw your circle spoke diagrams in the ConceptDraw PRO diagramming and vector drawing software extended with the Circle-Spoke Diagrams solution from the area "What is a Diagram" of ConceptDraw Solution Park.
Use these shapes to draw your circle spoke diagrams in the ConceptDraw PRO diagramming and vector drawing software extended with the Circle-Spoke Diagrams solution from the area "What is a Diagram" of ConceptDraw Solution Park.
Circle-Spoke Diagram 1
Circle-Spoke Diagram 2
Circle-Spoke Diagram 3
Circle-spoke diagram 4
Circle-Spoke Diagram 5
Circle-Spoke Diagram 6
Circle-Spoke Diagram 7
Circle-Spoke Diagram 8
Basic Flowchart Symbols and Meaning


This circle diagram sample was redesigned from the Wikimedia Commons file: Research cycle.png. "Some of the basic elements of the scientific method, arranged in a cycle to emphasize that it is an iterative process." [commons.wikimedia.org/ wiki/ File:Research_ cycle.png]
This file is licensed under the Creative Commons Attribution 2.0 Generic license. [creativecommons.org/ licenses/ by/ 2.0/ deed.en]
"The scientific method is a body of techniques for investigating phenomena, acquiring new knowledge, or correcting and integrating previous knowledge. To be termed scientific, a method of inquiry must be based on empirical and measurable evidence subject to specific principles of reasoning. ...
Four essential elements of the scientific method are iterations, recursions, interleavings, or orderings of the following:
(1) Characterizations (observations, definitions, and measurements of the subject of inquiry).
(2) Hypotheses (theoretical, hypothetical explanations of observations and measurements of the subject).
(3) Predictions (reasoning including logical deduction from the hypothesis or theory).
(4) Experiments (tests of all of the above)...
A linearized, pragmatic scheme of the four points above is sometimes offered as a guideline for proceeding:
(1) Define a question.
(2) Gather information and resources (observe).
(3) Form an explanatory hypothesis.
(4) Test the hypothesis by performing an experiment and collecting data in a reproducible manner.
(5) Analyze the data.
(6) Interpret the data and draw conclusions that serve as a starting point for new hypothesis.
(7) Publish results.
(8) Retest (frequently done by other scientists).
The iterative cycle inherent in this step-by-step method goes from point 3 to 6 back to 3 again." [Scientific method. Wikipedia]
The circle diagram example "Research cycle" was created using the ConceptDraw PRO diagramming and vector drawing software extended with the Target and Circular Diagrams solution from the Marketing area of ConceptDraw Solution Park.
www.conceptdraw.com/ solution-park/ marketing-target-and-circular-diagrams
Circle diagram

The vector stencils library "Circular arrows diagrams" contains 20 templates of circular arrows diagrams and arrow donut charts.
Use these shapes to draw your circular arrows diagrams in the ConceptDraw PRO diagramming and vector drawing software.
The vector stencils library "Circular arrows diagrams" is included in the Circular Arrows Diagrams solution from the area "What is a Diagram" of ConceptDraw Solution Park.
Use these shapes to draw your circular arrows diagrams in the ConceptDraw PRO diagramming and vector drawing software.
The vector stencils library "Circular arrows diagrams" is included in the Circular Arrows Diagrams solution from the area "What is a Diagram" of ConceptDraw Solution Park.
Circular arrows diagram - 3 elements
Circular arrows diagram - 4 elements
Circular arrows diagram - 5 elements
Circular arrows diagram - 6 elements
Circular arrows diagram - 7 elements
Arrows donut chart - 3 slices
Arrows donut chart - 4 slices
Arrows donut chart - 5 slices
Arrows donut chart - 6 slices
Arrows donut chart - 7 slices
Ring chart - 3 elements
Ring chart - 4 elements
Ring chart - 5 elements
Ring chart - 6 elements
Ring chart - 7 elements
Arrow circle diagram - 3 elements
Arrow circle diagram - 4 elements
Arrow circle diagram - 5 elements
Arrow circle diagram - 6 elements
Arrow circle diagram - 7 elements
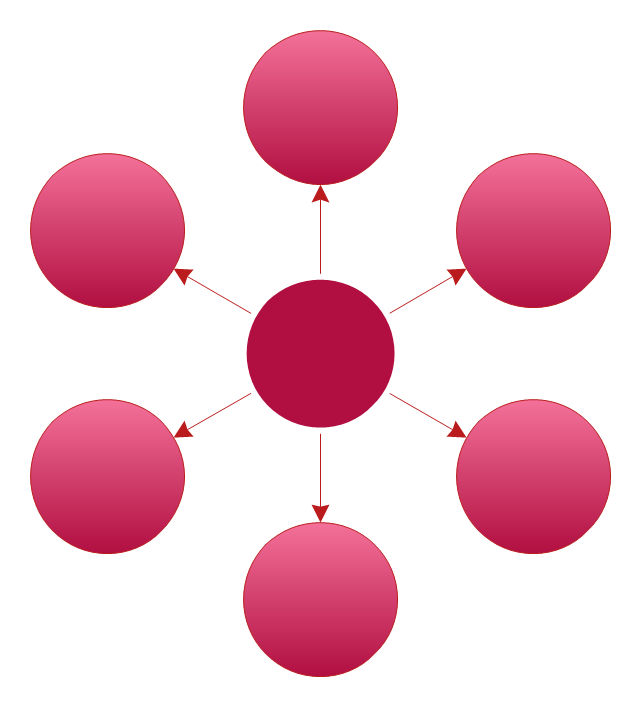
This circle-spoke diagram sample shows the social determinants of health. It was created on the base of the hub-and-spoke diagram from the Health Canada website. [hc-sc.gc.ca/ sr-sr/ pubs/ hpr-rpms/ bull/ 2005-climat/ 2005-climat-6-eng.php]
"Social determinants of health are the economic and social conditions – and their distribution among the population – that influence individual and group differences in health status. They are risk factors found in one's living and working conditions (such as the distribution of income, wealth, influence, and power), rather than individual factors (such as behavioural risk factors or genetics) that influence the risk for a disease, or vulnerability to disease or injury. According to some viewpoints, these distributions of social determinants are shaped by public policies that reflect the influence of prevailing political ideologies of those governing a jurisdiction. ...
In 2003, the World Health Organization (WHO) Europe suggested that the social determinants of health included:
(1) Social gradients (life expectancy is shorter and disease is more common further down the social ladder).
(2) Stress (including stress in the workplace).
(3) Early childhood development.
(4) Social exclusion.
(5) Unemployment.
(6) Social support networks.
(7) Addiction.
(8) Availability of healthy food.
(9) Availability of healthy transportation." [Social determinants of health. Wikipedia]
The hub-and-spoke diagram example "Social determinants of health" was created using the ConceptDraw PRO diagramming and vector drawing software extended with the Circle-Spoke Diagrams solution from the area "What is a Diagram" of ConceptDraw Solution Park.
Circle-spoke diagram

The vector stencils library "Circle-spoke diagram" contains 8 templates of circle-spoke diagrams.
Use these shapes to draw your circle spoke diagrams in the ConceptDraw PRO diagramming and vector drawing software extended with the Circle-Spoke Diagrams solution from the area "What is a Diagram" of ConceptDraw Solution Park.
Use these shapes to draw your circle spoke diagrams in the ConceptDraw PRO diagramming and vector drawing software extended with the Circle-Spoke Diagrams solution from the area "What is a Diagram" of ConceptDraw Solution Park.
Circle-Spoke Diagram 1
Circle-Spoke Diagram 2
Circle-Spoke Diagram 3
Circle-spoke diagram 4
Circle-Spoke Diagram 5
Circle-Spoke Diagram 6
Circle-Spoke Diagram 7
Circle-Spoke Diagram 8
HelpDesk
Downloading the Old Versions of ConceptDraw Products

 iPhone User Interface
iPhone User Interface solution extends ConceptDraw PRO v10 software with templates, samples and libraries with large quantity of vector stencils of graphical user interface elements, Apps icons, UI patterns for designing and prototyping of the iOS applic
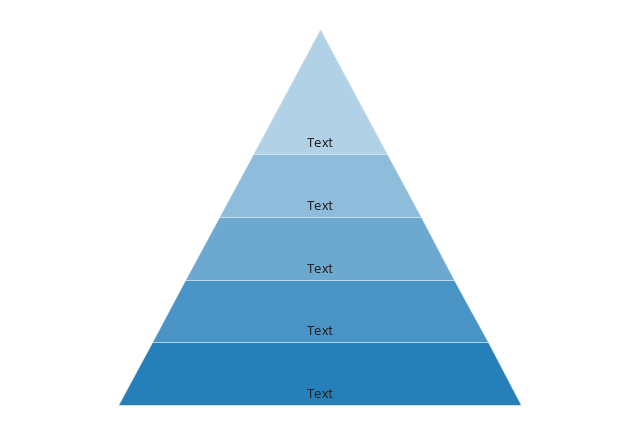
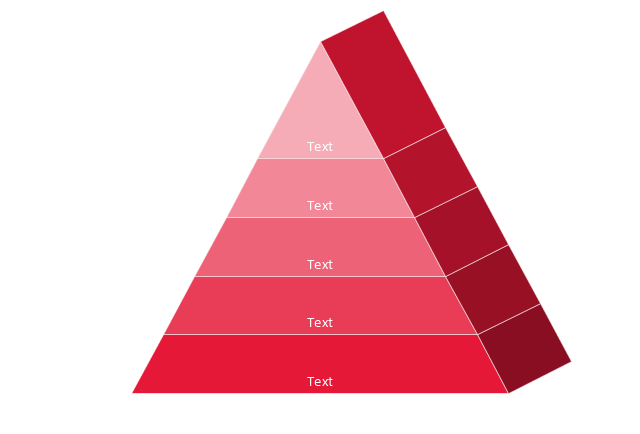
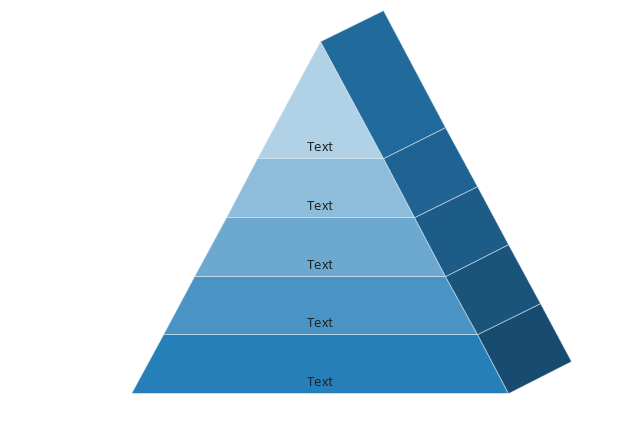
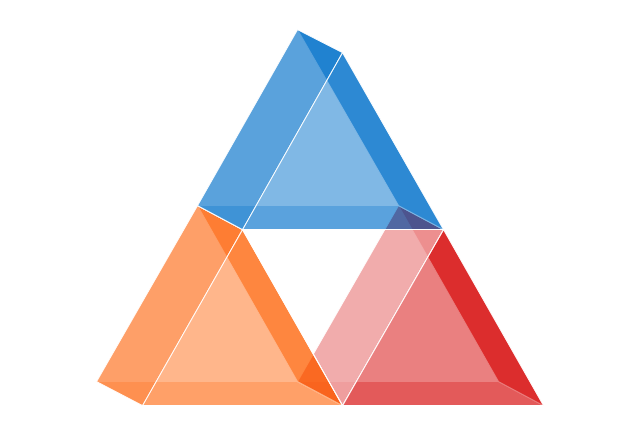
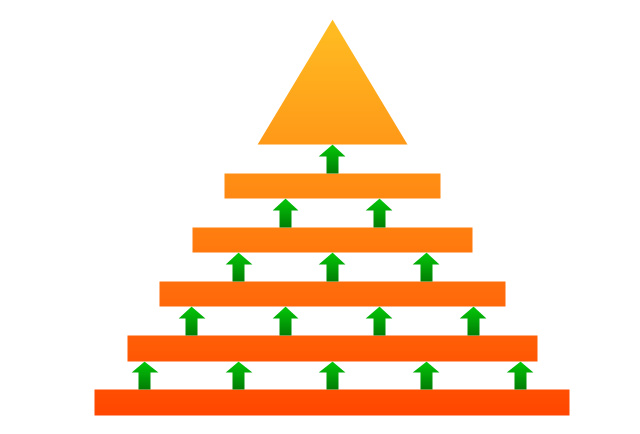
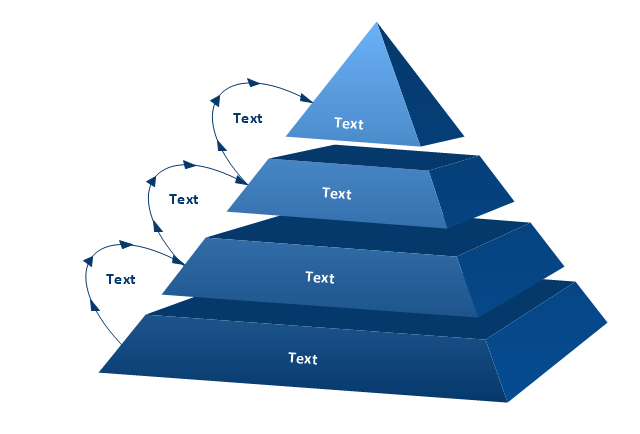
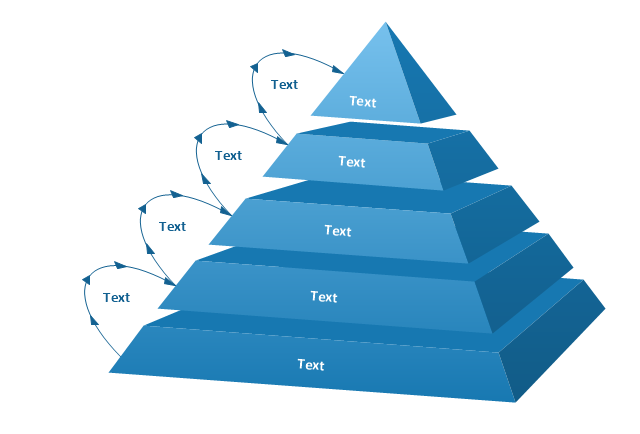
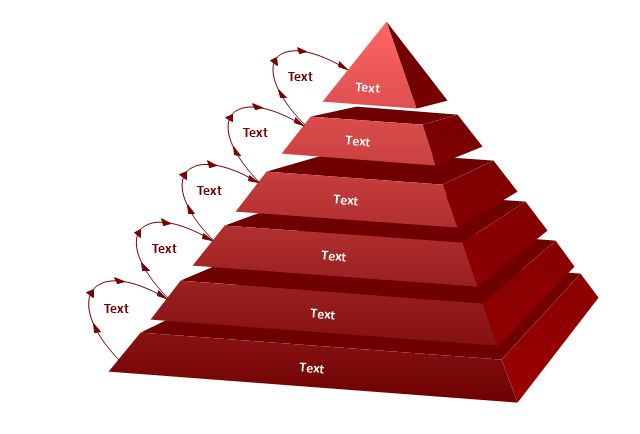
The vector stencils library "Pyramid diagrams" contains 28 templates of pyramid diagrams, triangle charts and triangular schemes.
Use these templates to create your pyramid diagrams in the ConceptDraw PRO diagramming and vector drawing software extended with the Pyramid Diagrams solution from the Marketing area of ConceptDraw Solution Park.
Use these templates to create your pyramid diagrams in the ConceptDraw PRO diagramming and vector drawing software extended with the Pyramid Diagrams solution from the Marketing area of ConceptDraw Solution Park.
Pyramid 1
Pyramid 2
Pyramid 3
Pyramid 4
Pyramid 5
Pyramid 1 Isometric
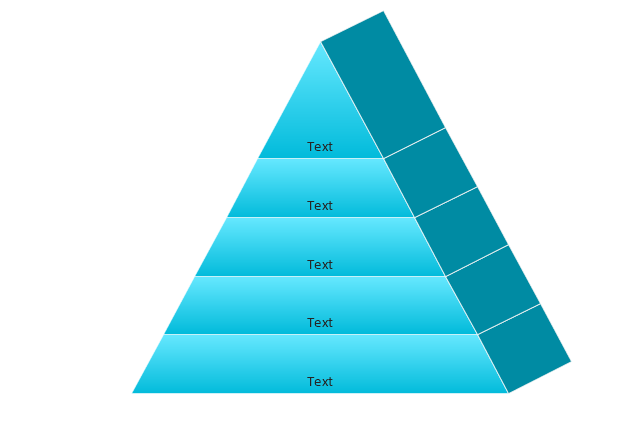
Pyramid 2 Isometric
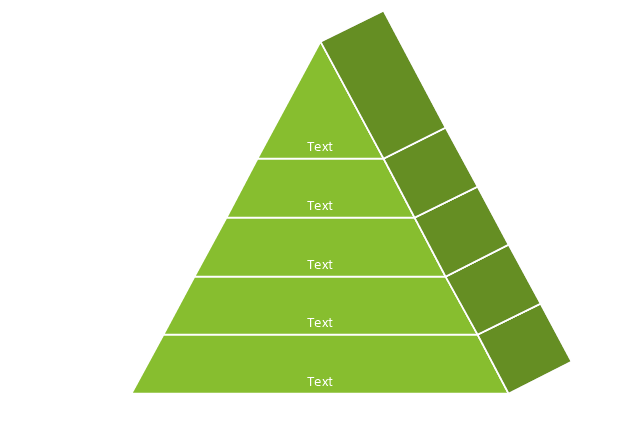
Pyramid 3 Isometric
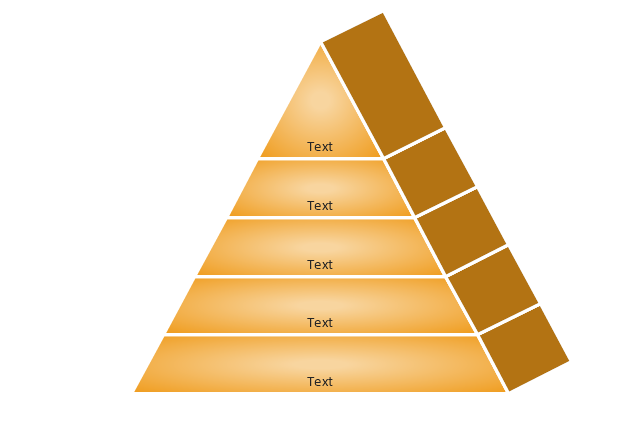
Pyramid 4 Isometric
Pyramid 5 Isometric
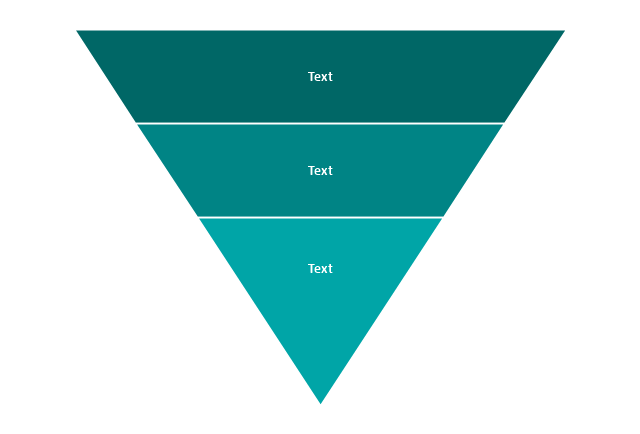
Triangle diagram, arrows
Triangle diagram
Triangular pyramid
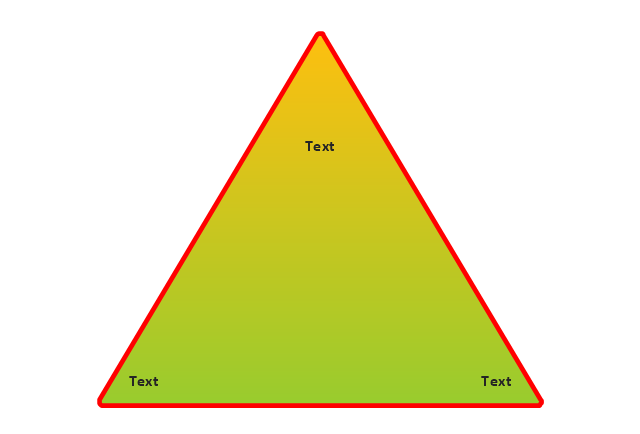
Triangular diagram
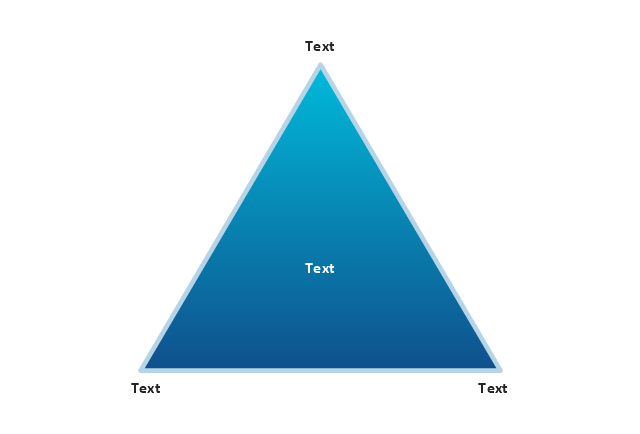
Triangle scheme
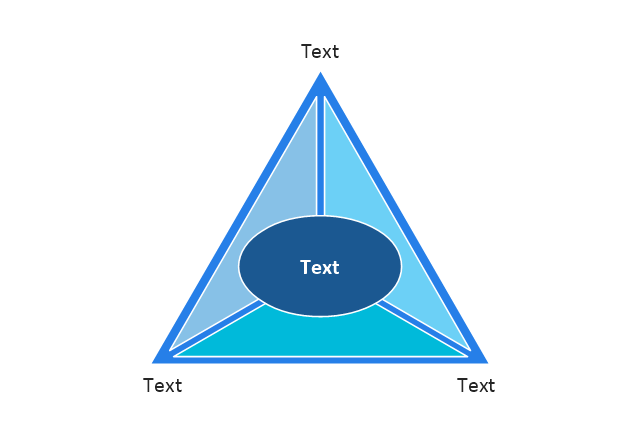
Triangle chart

Triangle chart, isometric
Triangular scheme
Arrowed block pyramid
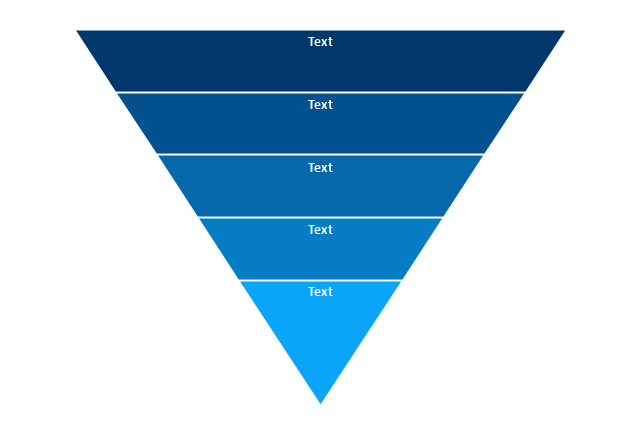
Funnel diagram
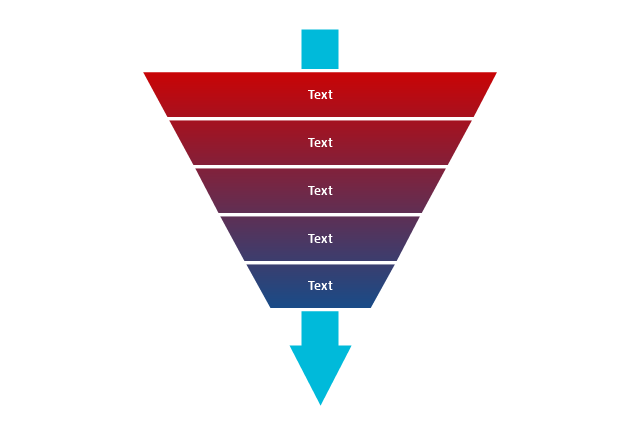
3-level funnel diagram
4-level funnel diagram
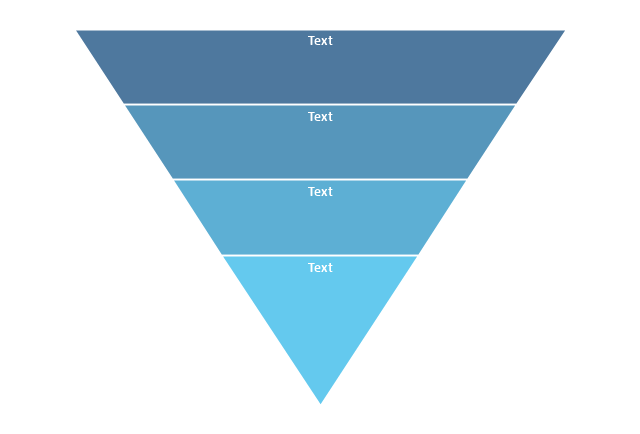
5-level funnel diagram
2-level pyramid diagram
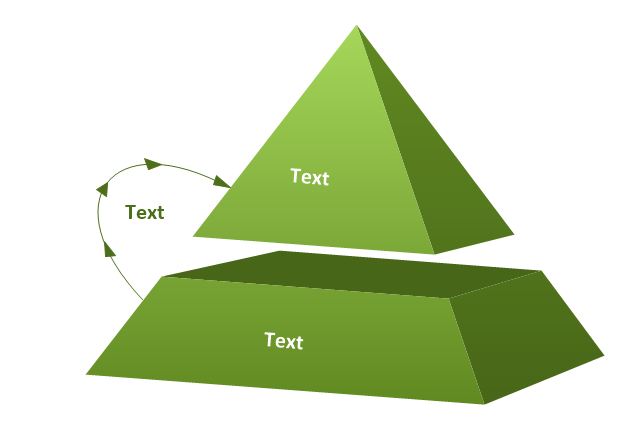
3-level pyramid diagram
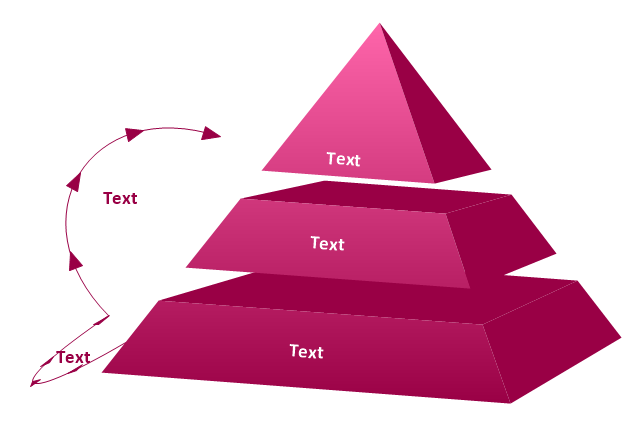
4-level pyramid diagram
5-level pyramid diagram
6-level pyramid diagram
Types of Flowcharts


- Arrow loop - 6 circles
- Circles Venn Diagram
- Venn Diagram 6 Circles
- Circular diagrams - Vector stencils library | Circles Venn Diagram ...
- Arrow circle chart - Template | How to Draw a Circular Arrows ...
- Arrow circle chart - Template | DFD Library - Design elements ...
- Pie Chart Examples and Templates | Arrow circle chart - Template ...
- Circle Diagram And Solution
- Circles Venn Diagram | Circle -Spoke Diagrams | Circular diagrams ...
- Circle Spoke Diagram Template | Circular diagrams - Vector stencils ...
- Venn Diagram In 3 Circles Solution
- 2 Circle Venn Diagrams
- Research cycle - Circle diagram | 3 Circle Venn Diagram. Venn ...
- 4 Circle Venn Diagram Template
- Venn Diagram With 5 Circles
- 6 Circles
- 3 Circle Venn Diagram. Venn Diagram Example | Venn Diagrams ...
- 2 Circle Venn Diagram. Venn Diagram Example | Venn Diagram ...
- Research cycle - Circle diagram | Lifecycle of an award - Circle ...
- 6 Way Venn Diagram Generator
- ERD | Entity Relationship Diagrams, ERD Software for Mac and Win
- Flowchart | Basic Flowchart Symbols and Meaning
- Flowchart | Flowchart Design - Symbols, Shapes, Stencils and Icons
- Flowchart | Flow Chart Symbols
- Electrical | Electrical Drawing - Wiring and Circuits Schematics
- Flowchart | Common Flowchart Symbols
- Flowchart | Common Flowchart Symbols