Pyramid Diagram

Pyramid Charts

A Pyramid Chart has the form of triangle and hierarchically structures, organizes and help to analyze the information, data or ideas. Triangle is divided on the sections that usually have different widths. The width indicates the level of hierarchy among the topics.
Pyramid Diagram and Pyramid Chart

Pyramid Diagram

Pyramid Diagram

Process Flow Chart Symbols

It is incredibly convenient to use the ConceptDraw DIAGRAM software extended with Flowcharts Solution from the "Diagrams" Area of ConceptDraw Solution Park for designing professional looking Process Flow Charts.
 25 Typical Orgcharts
The 25 Typical Orgcharts solution contains powerful organizational structure and organizational management drawing tools, a variety of professionally designed organization chart and matrix organization structure samples, 25 templates based on various orga
Network Diagramming with ConceptDraw DIAGRAM
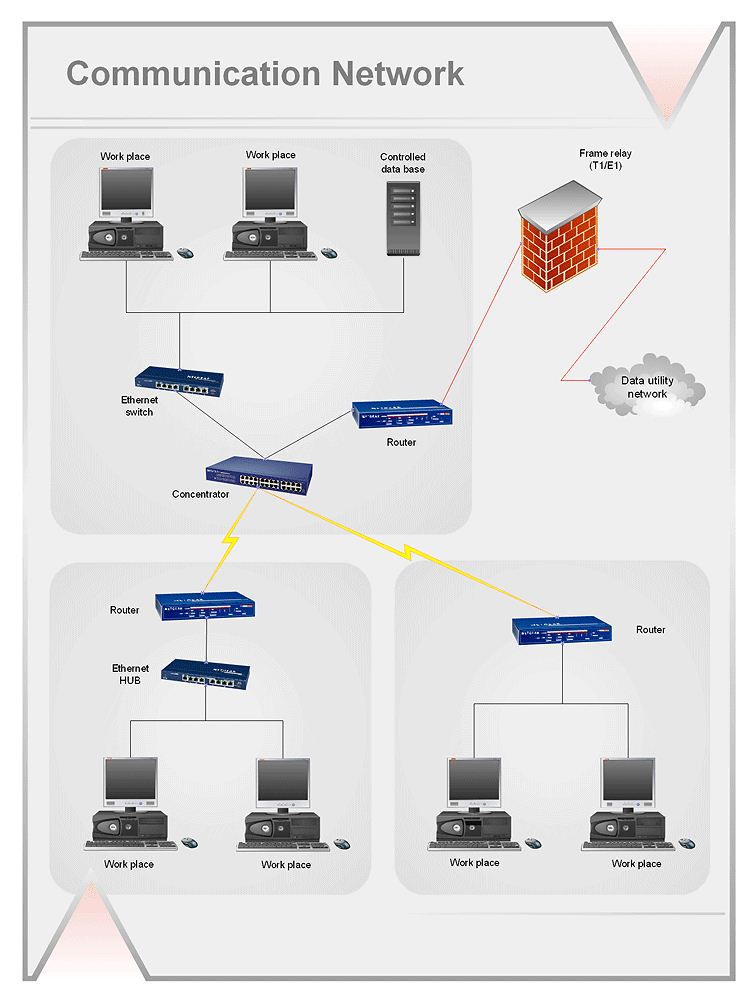
 Computer Network Diagrams
Computer Network Diagrams solution extends ConceptDraw DIAGRAM software with samples, templates and libraries of vector icons and objects of computer network devices and network components to help you create professional-looking Computer Network Diagrams, to plan simple home networks and complex computer network configurations for large buildings, to represent their schemes in a comprehensible graphical view, to document computer networks configurations, to depict the interactions between network's components, the used protocols and topologies, to represent physical and logical network structures, to compare visually different topologies and to depict their combinations, to represent in details the network structure with help of schemes, to study and analyze the network configurations, to communicate effectively to engineers, stakeholders and end-users, to track network working and troubleshoot, if necessary.
 Stakeholder Onion Diagrams
The Stakeholder Onion Diagram is often used as a way to view the relationships of stakeholders to a project goal. A basic Onion Diagram contains a rich information. It shows significance of stakeholders that will have has influence to the success achieve
- Stakeholder Onion Diagrams | 5 Layer Pyramid
- 4 Level pyramid model diagram - Information systems types ...
- Pyramid Diagrams | Divided Bar Diagrams | Pyramid Divided By 5
- Pyramid Diagram | 4 Level pyramid model diagram - Information ...
- Pyramid Of Information At 4 Layers
- Pyramid Diagram | Stakeholder Onion Diagrams | 4 Layers Of ...
- 4 Level pyramid model diagram - Information systems types | 5 Level ...
- Pyramid Diagram | Process Flowchart | Pyramid Diagram | Chart Of ...
- Pyramid Diagram | 5 Level pyramid model diagram - Information ...
- Pyramid Diagram
- ERD | Entity Relationship Diagrams, ERD Software for Mac and Win
- Flowchart | Basic Flowchart Symbols and Meaning
- Flowchart | Flowchart Design - Symbols, Shapes, Stencils and Icons
- Flowchart | Flow Chart Symbols
- Electrical | Electrical Drawing - Wiring and Circuits Schematics
- Flowchart | Common Flowchart Symbols
- Flowchart | Common Flowchart Symbols