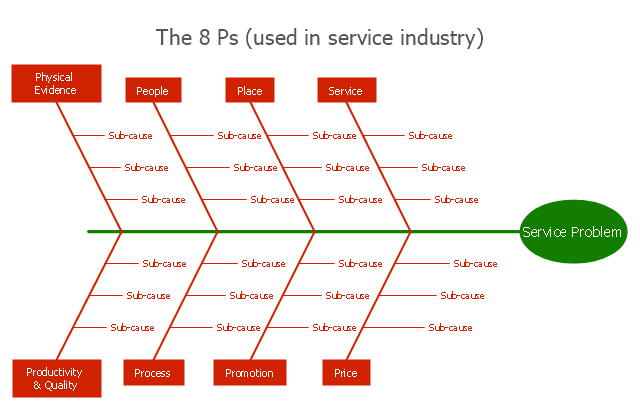
"Causes in the diagram are often categorized, such as to ...
The 7 Ps (used in marketing industry):
(1) Product/ Service;
(2) Price;
(3) Place;
(4) Promotion;
(5) People/ personnel;
(6) Positioning;
(7) Packaging. " [Ishikawa diagram. Wikipedia]
This 8 Ps Ishikawa diagram (service cause and effect diagram) template is included in the Fishbone Diagram solution from the Management area of ConceptDraw Solution Park.
 Fishbone Diagram
Fishbone Diagrams solution extends ConceptDraw PRO software with templates, samples and library of vector stencils for drawing the Ishikawa diagrams for cause and effect analysis.
Fishbone Diagram Procedure
ConceptDraw PRO diagramming and vector drawing software enhanced with Fishbone Diagrams solution from the Management area of ConceptDraw Solution Park gives the ability to draw Fishbone diagram, which identifies many possible causes for an effect for problem solving. Fishbone Diagram procedure of creation includes the set of steps easy for execution in ConceptDraw PRO.Fishbone Diagram Template
A causal model is an abstract concept, that describes the causal mechanisms of a system, by noting certain variables and their influence on each other, in an effort to discover the cause of a certain problem or flaw. This model is presented in diagram form by using a fishbone diagram.ConceptDraw PRO diagramming and vector drawing software enhanced with Fishbone Diagrams solution helps you create business productivity diagrams from Fishbone diagram templates and examples, that provide to start using of the graphic method for the analysis of problem causes. Each predesigned Fishbone Diagram template is ready to use and useful for instantly drawing your own Fishbone Diagram.
 Fishbone Diagrams
The Fishbone Diagrams solution extends ConceptDraw PRO v10 software with the ability to easily draw the Fishbone Diagrams (Ishikawa Diagrams) to clearly see the cause and effect analysis and also problem solving. The vector graphic diagrams produced using this solution can be used in whitepapers, presentations, datasheets, posters, and published technical material.
Total Quality Management Value
The Total Quality Management Diagram solution helps you and your organization visualize business and industrial processes. Create Total Quality Management diagrams for business process with ConceptDraw software.- Service 8 Ps fishbone diagram - Template | Fishbone Diagram ...
- 4 PS Fishbone Diagram
- Fishbone Diagram | Service 8 Ps fishbone diagram - Template ...
- Service 8 Ps fishbone diagram - Template | SWOT analysis for a ...
- Fishbone Diagram 4 Ps
- Fishbone Diagram | Service 4 Ss fishbone diagram - Template ...
- Service 4 Ss fishbone diagram - Template | Fishbone Diagram ...
- Service 8 Ps fishbone diagram - Template | SWOT analysis for a ...
- Service 4 Ss fishbone diagram - Template | Service 8 Ps fishbone ...
- Service 8 Ps fishbone diagram - Template | How Do Fishbone ...
- 4 P Diagram
- Fishbone Diagram Example For Service Industry
- Service 8 Ps fishbone diagram - Template | Service 4 Ss fishbone ...
- Service 4 Ss fishbone diagram - Template | Process Flowchart ...
- Service 8 Ps fishbone diagram - Template | Accounting Flowcharts ...
- Fishbone Diagram | Draw Fishbone Diagram on MAC Software ...
- Service 8 Ps fishbone diagram - Template | Management | Quality ...
- Flow chart Example. Warehouse Flowchart | Floor Plans | Fishbone ...
- Fishbone Diagram | Fishbone Diagram Template | Service 8 Ps ...
- Service 8 Ps fishbone diagram - Template | Management | Service ...
- ERD | Entity Relationship Diagrams, ERD Software for Mac and Win
- Flowchart | Basic Flowchart Symbols and Meaning
- Flowchart | Flowchart Design - Symbols, Shapes, Stencils and Icons
- Flowchart | Flow Chart Symbols
- Electrical | Electrical Drawing - Wiring and Circuits Schematics
- Flowchart | Common Flowchart Symbols
- Flowchart | Common Flowchart Symbols


