"Causes in the diagram are often categorized, such as to the 6 M's ...
The 6 Ms (used in manufacturing industry)
- Machine (technology)
- Method (process)
- Material (Includes Raw Material, Consumables and Information.)
- Man Power (physical work)/ Mind Power (brain work): Kaizens, Suggestions
- Measurement (Inspection)
- Milieu/ Mother Nature (Environment)
The original 6Ms used by the Toyota Production System have been expanded by some to include the following and are referred to as the 8Ms. However, this is not globally recognized. It has been suggested to return to the roots of the tools and to keep the teaching simple while recognizing the original intent; most programs do not address the 8Ms.
- Management/ Money Power
- Maintenance" [Ishikawa diagram. Wikipedia]
The 4Ms fishbone diagram (cause and effect diagram, Ishikawa diagram) example "Production process" was created using the ConceptDraw PRO diagramming and vector drawing software extended with the Fishbone Diagrams solution from the Management area of ConceptDraw Solution Park.
4Ms Ishikawa diagram

"Causes in the diagram are often categorized, such as to the 6 M's ...
The 6 Ms (used in manufacturing industry):
(1) Machine (technology);
(2) Method (process);
(3) Material (Includes Raw Material, Consumables and Information.);
(4) Man Power (physical work)/ Mind Power (brain work): Kaizens, Suggestions;
(5) Measurement (Inspection);
(6) Milieu/ Mother Nature (Environment).
The original 6Ms used by the Toyota Production System have been expanded by some to include the following and are referred to as the 8Ms. However, this is not globally recognized. It has been suggested to return to the roots of the tools and to keep the teaching simple while recognizing the original intent; most programs do not address the 8Ms.
(7) Management/ Money Power;
(8) Maintenance." [Ishikawa diagram. Wikipedia]
This 8Ms Ishikawa diagram (manufacturing cause and effect diagram) template is included in the Fishbone Diagram solution from the Management area of ConceptDraw Solution Park.
8Ms Ishikawa diagram

Defensive Formation – 4-3 Defense Diagram

The vector stencils library "MS Windows Vista user interface" contains 76 MS Windows Vista design elements.
Use it for designing Microsoft ribbon graphic user interface (GUI) of software for computers with MS Windows Vista OS in the ConceptDraw PRO diagramming and vector drawing software extended with the Graphic User Interface solution from the Software Development area of ConceptDraw Solution Park.
Use it for designing Microsoft ribbon graphic user interface (GUI) of software for computers with MS Windows Vista OS in the ConceptDraw PRO diagramming and vector drawing software extended with the Graphic User Interface solution from the Software Development area of ConceptDraw Solution Park.
Window
Dialog Window
Empty Window

Field

Horizontal Scrollbar
Vertical Scrollbar
Window Buttons
Window Buttons
Window Button 1

Window Button 2

Window Button 3

Window Button 4

Navigation

Menu Bar
Gradient Menu Bar
Drop-down Menu
Button
Toolbar Pannel

Tool Button

Primary Toolbar

Toolbar 1
Toolbar 2
Customizable Tollbar

Tab View
List View
Text Field

Vertical Separator

Horizontal Separator

Group Box

Text Label

Link

Line Edit

Search

Search with Button

Spin Box
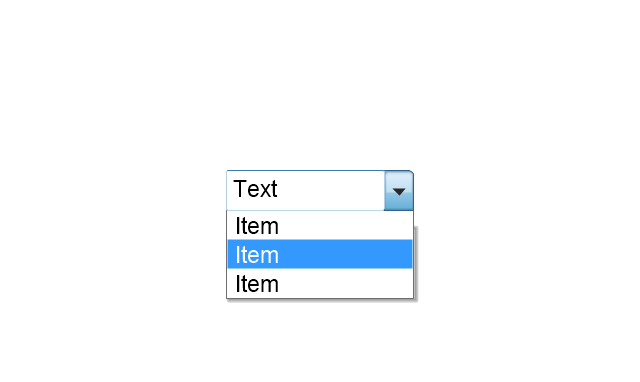
Combo-box
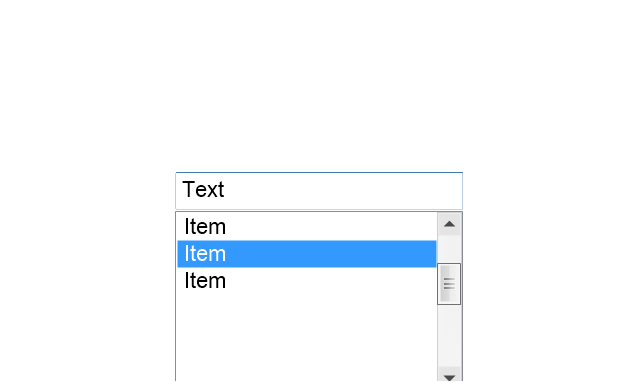
Editable Combo-box
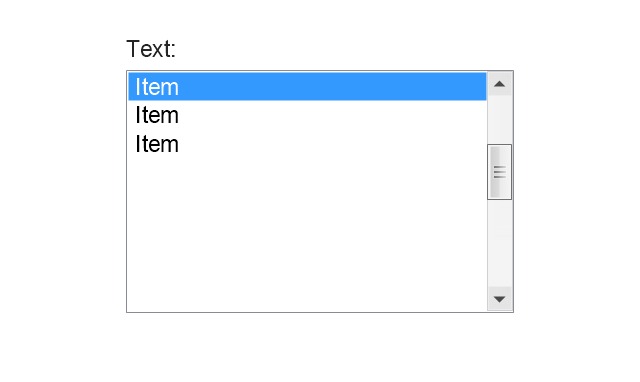
Editable List Box
List Box
Single-selection List
Multiple-selection List
Check Box

Radio Button
Check box group

Radio Buttons Group
Progress Bar

Modal Progress Bar

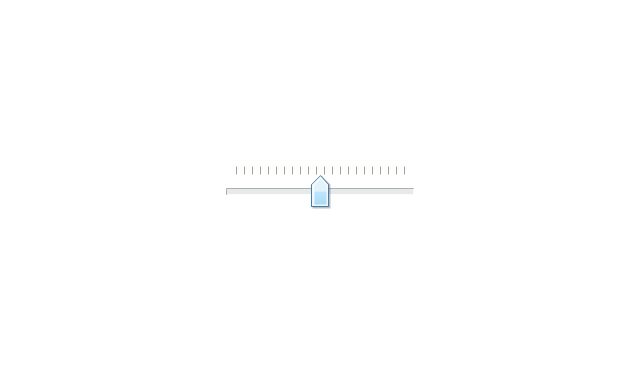
Vertical Slider with Ticks
Horizontal Slider with Ticks
Dial

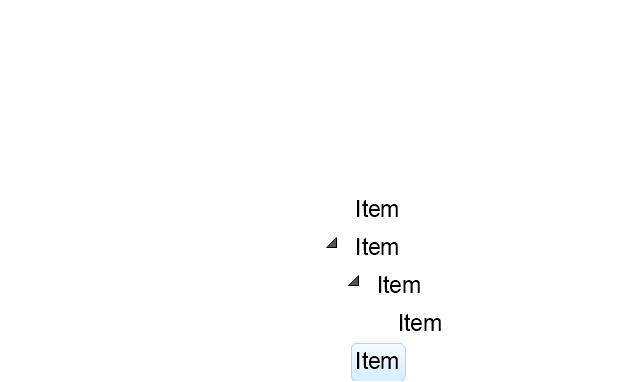
Catalogue Tree

Tree View 1
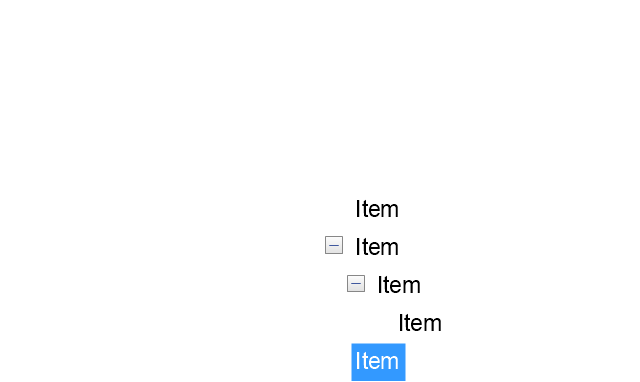
Tree View 2
Vertical Spacer

Horizontal Spacer

Chevron 1
Arrow 1
Arrow 2
Plus/Minus Control

Rotating Triangle

Chevron 3
Chevron 2
Normal Select Cursor

Link Select Cursor

Text Select Cursor

Working in Background Pointer

Busy Pointer

Unavailable Cursor

Precision Select Cursor

Error Icon
Warning Icon
Information Icon
Question Mark Icon
Balloon

Tooltip/Infotip

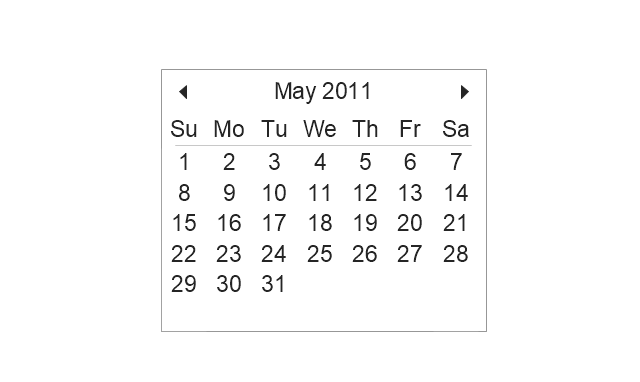
Calendar
HelpDesk
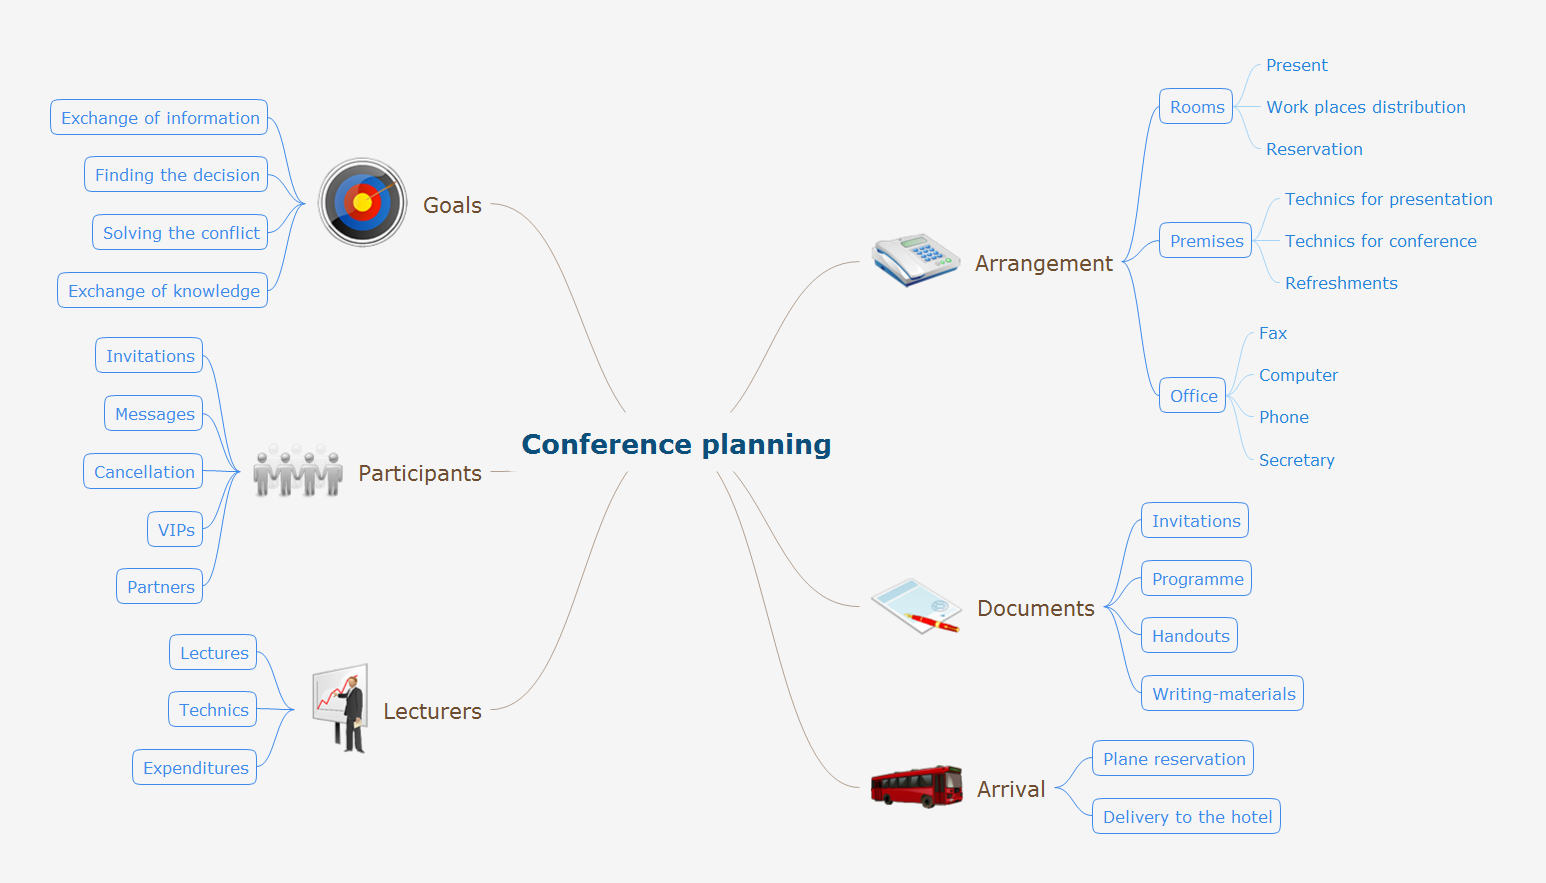
How to Draw a Pyramid Diagram

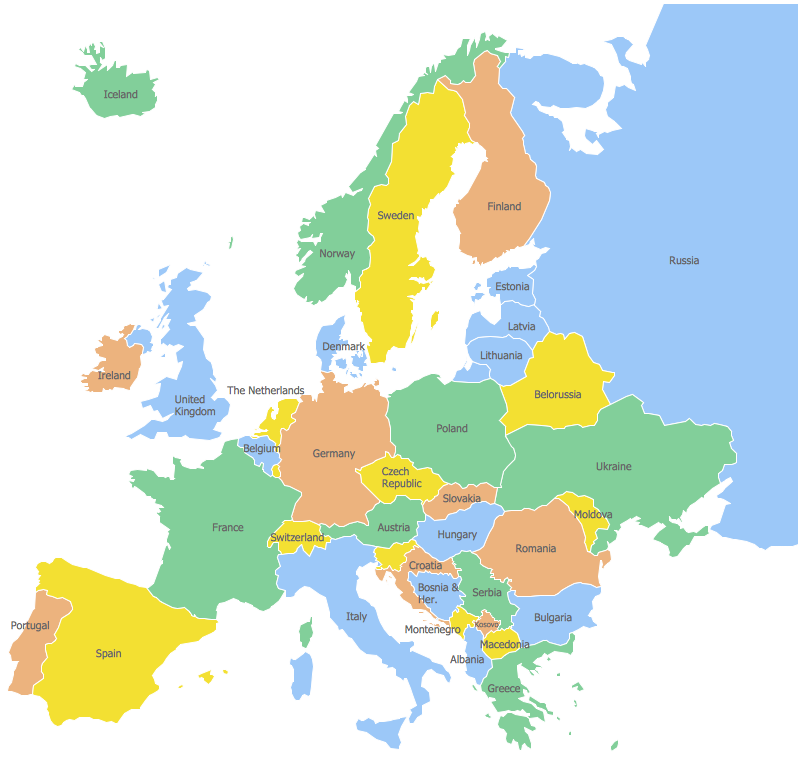
Geo Map — Europe
HelpDesk
How to Exchange Files with MS Project Users

HelpDesk
How to Upgrade ConceptDraw OFFICE -3
Mechanical Drawing Software

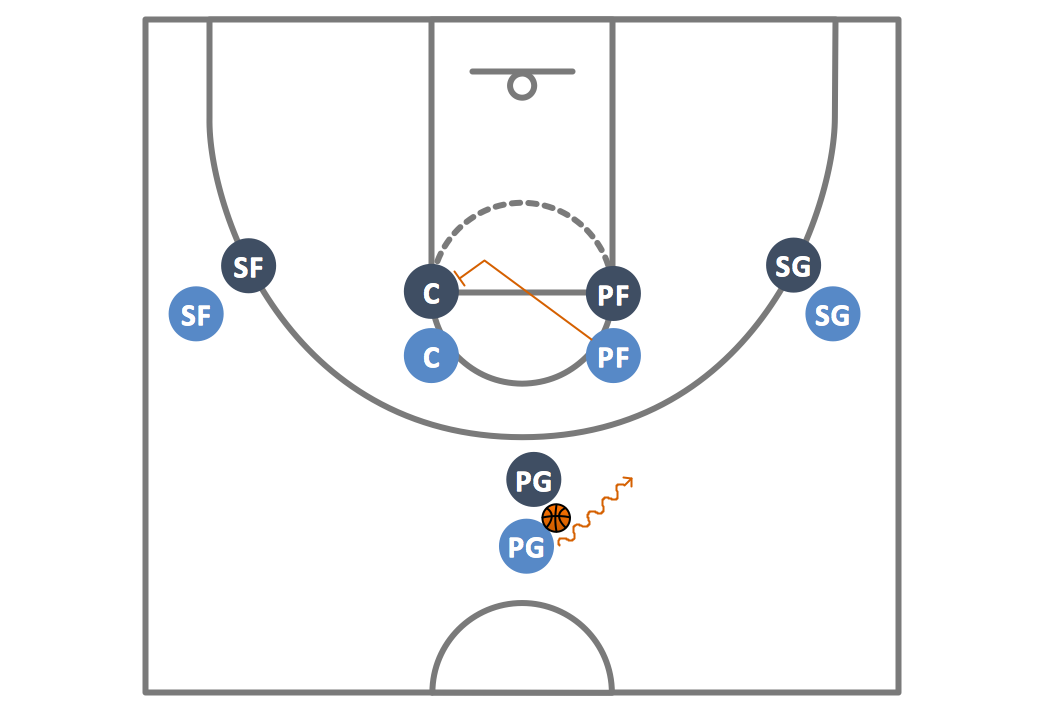
Basketball Plays Diagrams
 Fishbone Diagram
Fishbone Diagrams solution extends ConceptDraw DIAGRAM software with templates, samples and library of vector stencils for drawing the Ishikawa diagrams for cause and effect analysis.
HelpDesk
How to Convert a Mind Map into MS Project XML

Network Diagram Software. LAN Network Diagrams. Physical Office Network Diagrams


Presenting a Slide Show to a Group of People

- Total Quality Management Value | Fishbone Diagram | 4ms Of ...
- 4 Ms fishbone diagram - Production process | Total Quality ...
- 4 Ms fishbone diagram - Production process | Manufacturing 8 Ms ...
- 4 Ms fishbone diagram - Production process
- What Is The 4ms Of Total Quality Management
- Process Flowchart | Total Quality Management Value | 4 Ms ...
- 4 Ms fishbone diagram - Production process | Fishbone Diagram ...
- 4 Ms fishbone diagram - Production process | Ishikawa Diagram ...
- 4 Ms fishbone diagram - Production process | Defensive Formation ...
- 4 Ms fishbone diagram - Production process | Manufacturing 8 Ms ...
- Fishbone Diagram | Manufacturing 8 Ms fishbone diagram ...
- Total Quality Management Value | 4 Ms fishbone diagram ...
- Fishbone Diagram | Draw Fishbone Diagram on MAC Software | 4 ...
- Process Flowchart | Total Quality Management Value | 4 Ms ...
- Ishikawa Diagram | Total Quality Management Value | 4 Ms fishbone ...
- Manufacturing 8 Ms fishbone diagram - Template | Fishbone ...
- Fishbone Diagram | 4 Ms fishbone diagram - Production process ...
- 4 Ms Of Production Ppt
- Manufacturing 8 Ms fishbone diagram - Template | 4 Ms fishbone ...
- Total Quality Management Value | Example Of 4ms
- ERD | Entity Relationship Diagrams, ERD Software for Mac and Win
- Flowchart | Basic Flowchart Symbols and Meaning
- Flowchart | Flowchart Design - Symbols, Shapes, Stencils and Icons
- Flowchart | Flow Chart Symbols
- Electrical | Electrical Drawing - Wiring and Circuits Schematics
- Flowchart | Common Flowchart Symbols
- Flowchart | Common Flowchart Symbols