3 Circle Venn. Venn Diagram Example

3 Circle Venn Diagram. Venn Diagram Example

Venn Diagrams visualize all possible logical intersections between several sets and are widely used in mathematics, logic, statistics, marketing, sociology, etc.
Venn Diagram Examples for Problem Solving. Venn Diagram as a Truth Table

Cylinder Venn Diagram

2 Circle Venn Diagram. Venn Diagram Example

Circuits and Logic Diagram Software

Electrical Engineering solution helps you create quick and easy: Electrical schematics, Digital and analog logic designs, Circuit and wiring schematics and diagrams, Power systems diagrams, Maintenance and repair diagrams, Circuit board and amplifier diagrams, Integrated circuit schematics.
Venn Diagram Template for Word

Venn Diagram Examples for Problem Solving. Environmental Social Science. Human Sustainability Confluence

Create your Venn diagrams for problem solving in environmental social science using the ConceptDraw DIAGRAM diagramming and vector drawing software extended with the Venn Diagrams solution from the area "Diagrams" of ConceptDraw Solution Park.
Venn Diagrams

ConceptDraw DIAGRAM diagramming and vector drawing software extended with Venn Diagrams solution from "Diagrams" area offers set of useful drawing tools for easy creating the Venn Diagrams for any quantity of sets.
Multi Layer Venn Diagram. Venn Diagram Example

UML Class Diagram Constructor
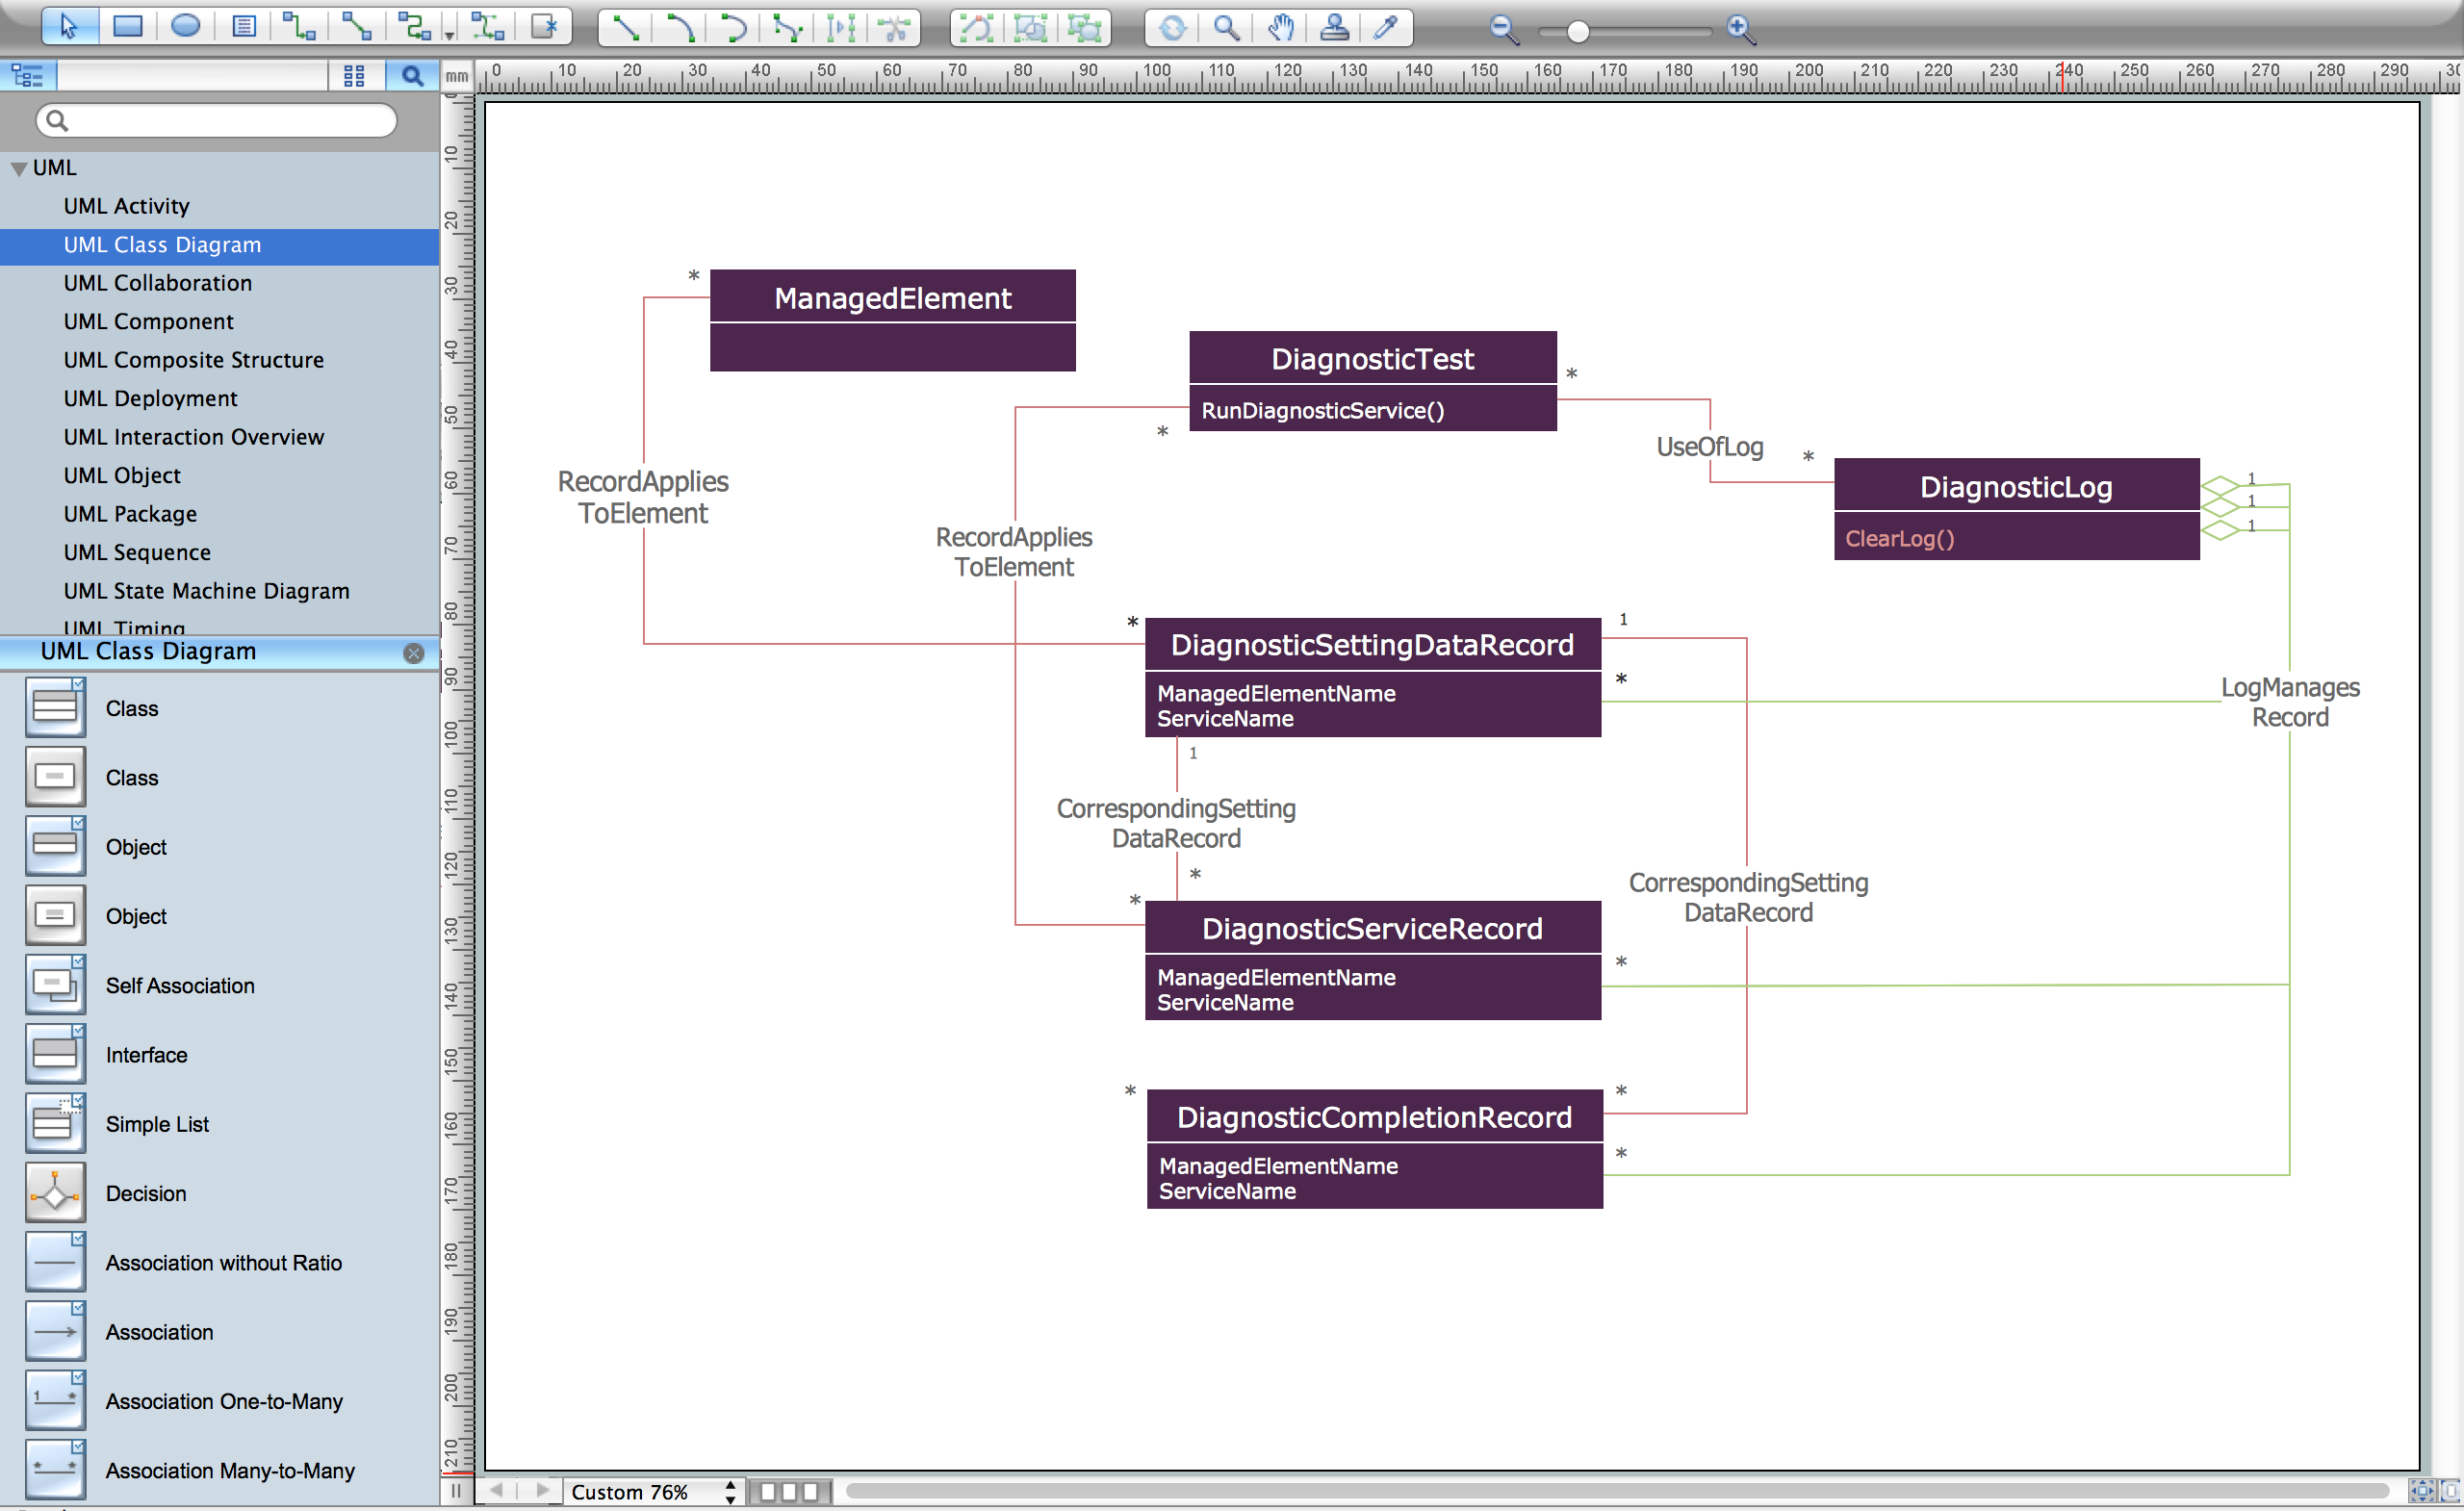
The Rapid UML Solution for ConceptDraw DIAGRAM includes the UML Class Diagram library that helps you to design the UML Class Diagram quick and easy. You can simply and quickly drop the ready-to-use objects from the library into your document to create the UML Class Diagram.
Circle Spoke Diagram Template

Using Fishbone Diagrams for Problem Solving

Using Fishbone Diagrams for Problem Solving is a productive and illustrative tool to identify the most important factors causing the trouble. ConceptDraw DIAGRAM extended with Fishbone Diagrams solution from the Management area of ConceptDraw Solution Park is a powerful tool for problem solving with Fishbone Ishikawa diagram graphic method.
Fishbone Diagram Problem Solving

To design easily the Fishbone diagram, you can use a special ConceptDraw DIAGRAM vector graphic and diagramming software which contains the powerful tools for Fishbone diagram problem solving offered by Fishbone Diagrams solution for the Management area of ConceptDraw Solution Park.
- 3sets Example Problem
- Venn Diagram Examples 3sets
- Venn Diagrams With 3 Sets
- 3 Circle Venn Diagram. Venn Diagram Example
- Cylinder Venn Diagram | Venn Diagram Examples for Problem ...
- Venn Diagram Examples 3 Sets
- Interactive Venn Diagram | Venn Diagram Examples for Problem ...
- 3 Circle Venn Diagram. Venn Diagram Example | Venn diagrams ...
- Example Of Sets For 3 Circles
- Venn Diagram Examples for Problem Solving. Venn Diagram as a ...
- Venn Diagram Examples for Problem Solving. Venn Diagram as a ...
- 3 Circle Venn. Venn Diagram Example | Venn Diagram Examples ...
- Venn Diagram Examples for Problem Solving. Computer Science ...
- 3 Circle Venn Diagram. Venn Diagram Example | Bar Diagrams for ...
- Venn Diagram Examples for Problem Solving. Venn Diagram as a ...
- Venn Diagram Examples for Problem Solving. Venn Diagram as a ...
- Venn Diagram Examples for Problem Solving. Venn Diagram as a
- Venn Diagrams Examples 2 Circles
- Basketball Court Dimensions | Venn Diagram Template | Cylinder ...
- Venn Diagram Examples for Problem Solving. Venn Diagram as a ...
- ERD | Entity Relationship Diagrams, ERD Software for Mac and Win
- Flowchart | Basic Flowchart Symbols and Meaning
- Flowchart | Flowchart Design - Symbols, Shapes, Stencils and Icons
- Flowchart | Flow Chart Symbols
- Electrical | Electrical Drawing - Wiring and Circuits Schematics
- Flowchart | Common Flowchart Symbols
- Flowchart | Common Flowchart Symbols