Pyramid Diagram

3D triangular diagram of DIKW pyramid has 6 levels: measurement, facts, data, information, knowledge, wisdom.
The data component include different scattered signs or symbols which are merely useless until these random objective facts are somehow processed. Data is a resource which has to be manipulated or rearranged to get useful. Information can be extracted from a pile of data, it also can be mined from different data storages.
Pyramid Diagram

Pyramid Diagram

Pyramid Diagram

Pyramid Diagram

How to Create a Pyramid Diagram

Pyramid Diagram

five level pyramid example is included in the Pyramid Diagrams solution from Marketing area of ConceptDraw Solution Park.
Pyramid Diagram

Pyramid Chart Examples

Pyramid Diagram

Pyramid Diagram

 Pyramid Diagrams
Pyramid Diagrams solution extends ConceptDraw DIAGRAM software with templates, samples and library of vector stencils for drawing the marketing pyramid diagrams.
Pyramid Diagram

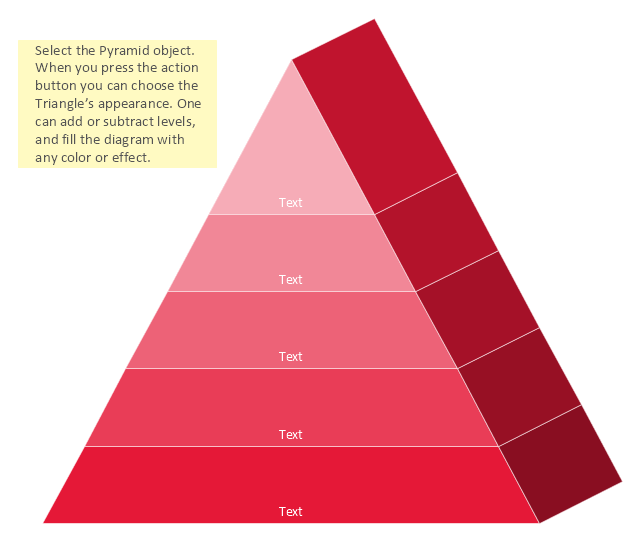
3D Triangle diagrams visualize the relationship building blocks as a triangle divided into horizontal slices, and may be oriented up or down. Labeled slices represent a hierarchy. They are used in marketing presentations to show and analyze hierarchy levels.
This 3D triangular diagram template for the ConceptDraw PRO diagramming and vector drawing software is included in the Pyramid Diagrams solution from the Marketing area of ConceptDraw Solution Park.
This 3D triangular diagram template for the ConceptDraw PRO diagramming and vector drawing software is included in the Pyramid Diagrams solution from the Marketing area of ConceptDraw Solution Park.
3D Triangular diagram
Pyramid Diagram

Pyramid Diagram

Pyramid Diagram

Funnel Diagram

In order to make a funnel diagram, the Funnel Diagrams solution can be used while working in the ConceptDraw DIAGRAM diagramming and drawing software. Having the pre-made design elements as well as the examples of funnel diagrams, the Funnel Diagrams solution allows any ConceptDraw DIAGRAM user to make their own unique as well as professionally-looking drawings.
Pyramid Diagram and Pyramid Chart

Fundraising Pyramid

- Pyramid Diagram | 3D Triangle diagram - Template | How to Create ...
- Strategic Triangle Pyrmid Model
- Pyramid Diagram | How to Create a Pyramid Diagram | Pyramid ...
- 5 Level pyramid model diagram - Information systems types ...
- Pyramid Diagram | 3D Triangle diagram - Template | How to Draw a ...
- Separating Funnel 3d Model
- Knowledge hierarchy triangle diagram | DIKW pyramid diagram | 5 ...
- Triangle In Er Diagram
- DIKW pyramid diagram | DIKW hierarchy - 3D Pyramid diagram ...
- 4-level 3D pyramid diagram - Template | How to Draw a Pyramid ...
- Pyramid diagram - Template | Triangle chart - Template | 3D ...
- 3D Triangle diagram - Template | 6-Level 3D pyramid diagram ...
- Pyramid Diagram
- 3d Chart On Separation Funnel
- Draw A Triangle With Five Levels
- Pyramid Diagram | 5 Level pyramid model diagram - Information ...
- Pyramid Diagram
- 3D Triangle diagram - Template | Pyramid Diagram | 3D Segmented ...
- 3D Triangle diagram - Template
- Triangle chart - Template | Project management triangle diagram ...
- ERD | Entity Relationship Diagrams, ERD Software for Mac and Win
- Flowchart | Basic Flowchart Symbols and Meaning
- Flowchart | Flowchart Design - Symbols, Shapes, Stencils and Icons
- Flowchart | Flow Chart Symbols
- Electrical | Electrical Drawing - Wiring and Circuits Schematics
- Flowchart | Common Flowchart Symbols
- Flowchart | Common Flowchart Symbols