Network Diagram Software. LAN Network Diagrams. Physical Office Network Diagrams


Entity Relationship Diagram Examples

ConceptDraw gives the ability to describe a database using the Entity-Relationship model. Entity-Relationship Diagram solution includes icons advocated by Chen's and Crow’s Foot notation that can be used when describing a database.

HelpDesk
How to Create a Bar Chart

The bar graph can be vertical or horizontal. This depends on the number of categories. There are many methods in which bar graph can be built and this makes it a very often used chart type. Usually, a bar chart is created so that the bars are placed vertically. Such an arrangement means that the bar's height value is proportional to the category value. Nevertheless, a bar chart can be also drawn horizontally. This means that the longer the bar, the bigger the category. Thus, a bar chart is a good way to present the relative values of different measured items. The ConceptDraw Bar Graphs solution allows you to draw a bar chart quickly using a vector library, containing the set of various bar charts objects.
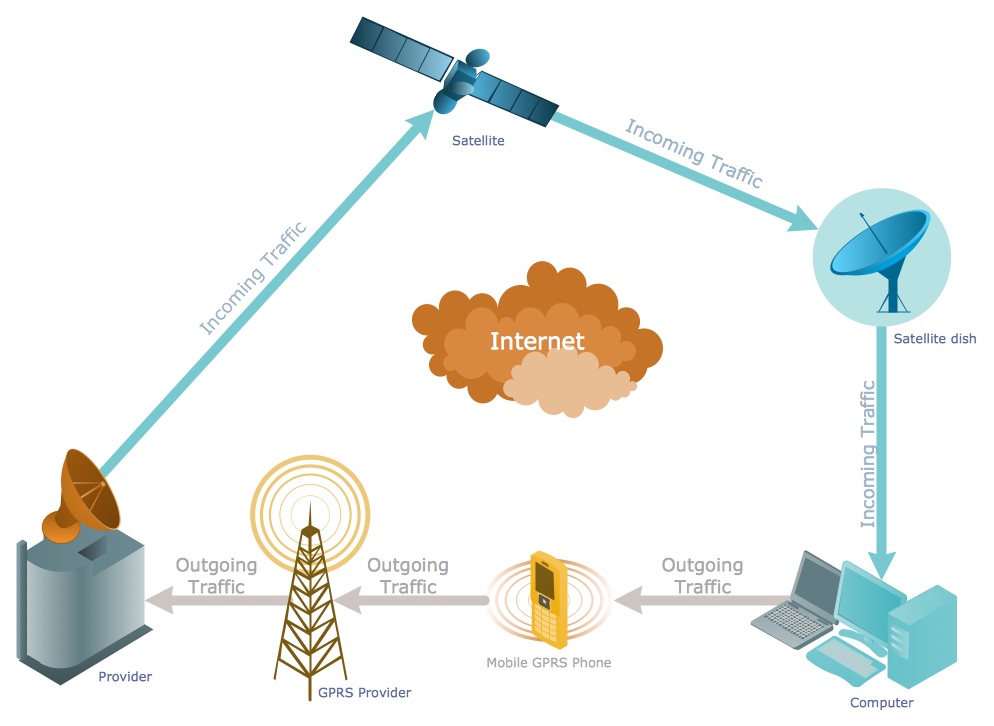
Telecommunications Networks
How To use House Electrical Plan Software

You can use many of built-in templates, electrical symbols and electical schemes examples of our House Electrical Diagram Software.
ConceptDraw is a fast way to draw: Electrical circuit diagrams, Schematics, Electrical Wiring, Circuit schematics, Digital circuits, Wiring in buildings, Electrical equipment, House electrical plans, Home cinema, Satellite television, Cable television, Closed-circuit television.
House Electrical Plan Software works across any platform, meaning you never have to worry about compatibility again. ConceptDraw DIAGRAM allows you to make electrical circuit diagrams on PC or macOS operating systems.

Process Flow Diagram Symbols

3D Network Diagram Software

Use more than 2 000 pre-designed 3D network elements for customizing your network diagrams. Computer & Networks solution allows you for design 3D LAN and WAN, schematic and wiring drawings.
HelpDesk
How to Draw a Histogram

Windows Azure
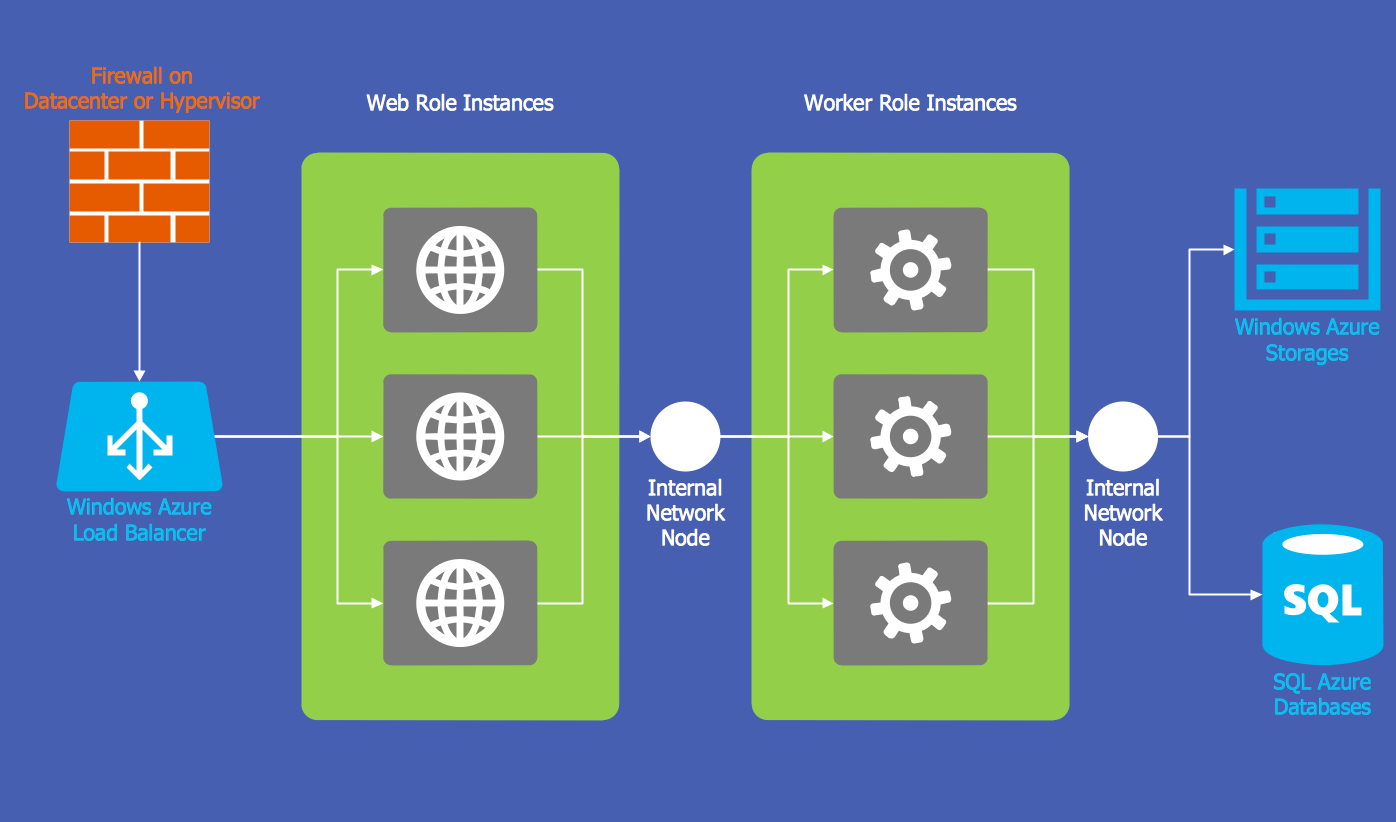
ConceptDraw DIAGRAM diagramming and vector drawing software provides the Azure Architecture Solution from the Computer and Networks area of ConceptDraw Solution Park with a lot of useful tools which make easier: illustration of Windows Azure possibilities and features, describing Windows Azure Architecture, drawing Azure Architecture Diagrams, depicting Azure Cloud System Architecture, describing Azure management, Azure storage, documenting Azure services.
Hypercube Network Topology
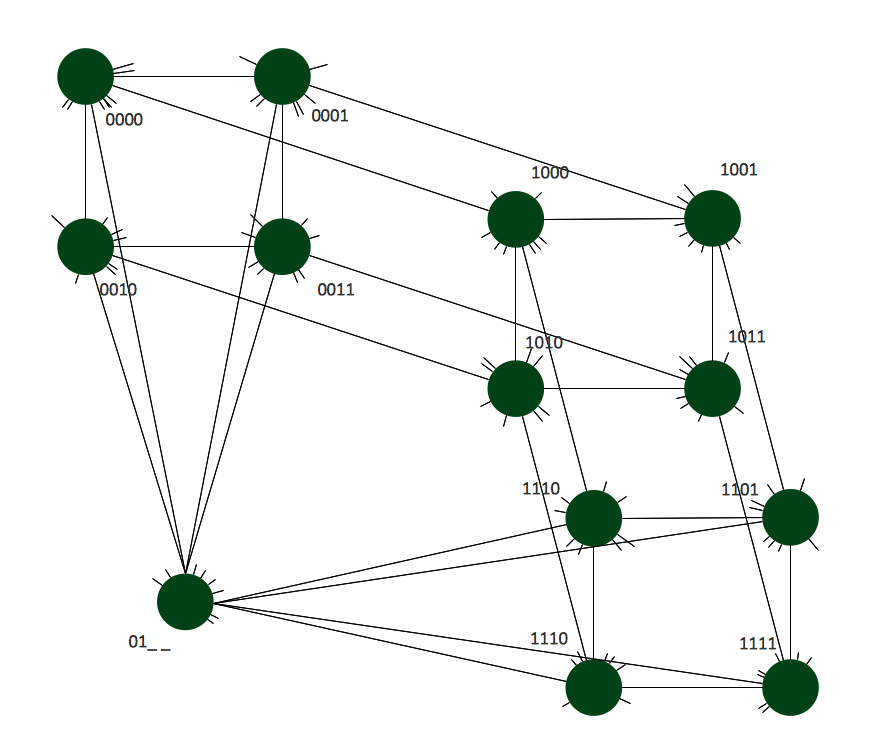
This sample shows the Hypercube network topology.
Network topology is the topological structure of the computer network.
Hypercube is a type of the toroidal network. The Torus is a topology with n-dimensional grid network with circularly connection of the nodes. If the number of nodes along each dimension of the toroidal network is 2, it is a Hypercube network topology.
- How to Draw a Pyramid Diagram in ConceptDraw PRO | 3d Building ...
- 3d Drawing In Visio
- Directional Maps | Directional 3d Visio
- How to Draw a Pyramid Diagram in ConceptDraw PRO | Visio 3d
- Visio Stencils Building Architecture 3d
- 3d Visio Shapes Car
- Visio Diagram 3d Exchange 2016
- Microsoft Visio 3d
- Histogram Chart | Make a Histogram | How To Draw a Histogram ...
- Visio Pyramid 6 Levels
- ERD | Entity Relationship Diagrams, ERD Software for Mac and Win
- Flowchart | Basic Flowchart Symbols and Meaning
- Flowchart | Flowchart Design - Symbols, Shapes, Stencils and Icons
- Flowchart | Flow Chart Symbols
- Electrical | Electrical Drawing - Wiring and Circuits Schematics
- Flowchart | Common Flowchart Symbols
- Flowchart | Common Flowchart Symbols