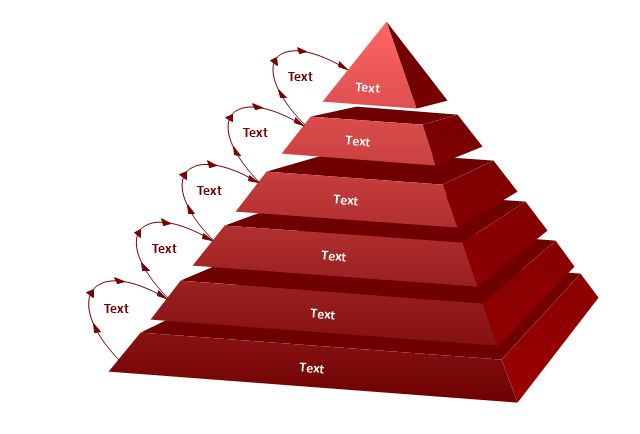
The vector stencils library "Pyramid diagrams" contains 28 templates of pyramid diagrams, triangle charts and triangular schemes.
Use these templates to create your pyramid diagrams in the ConceptDraw PRO diagramming and vector drawing software extended with the Pyramid Diagrams solution from the Marketing area of ConceptDraw Solution Park.
Use these templates to create your pyramid diagrams in the ConceptDraw PRO diagramming and vector drawing software extended with the Pyramid Diagrams solution from the Marketing area of ConceptDraw Solution Park.
Pyramid 1
Pyramid 2
Pyramid 3
Pyramid 4
Pyramid 5
Pyramid 1 Isometric
Pyramid 2 Isometric
Pyramid 3 Isometric
Pyramid 4 Isometric
Pyramid 5 Isometric
Triangle diagram, arrows
Triangle diagram
Triangular pyramid
Triangular diagram
Triangle scheme
Triangle chart

Triangle chart, isometric
Triangular scheme
Arrowed block pyramid

Funnel diagram
3-level funnel diagram
4-level funnel diagram
5-level funnel diagram
2-level pyramid diagram
3-level pyramid diagram
4-level pyramid diagram
5-level pyramid diagram
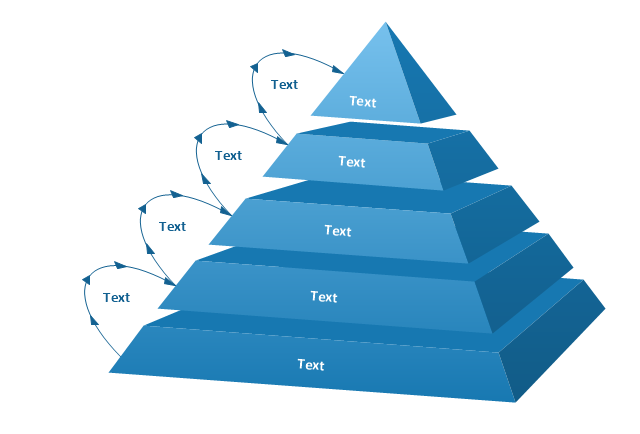
6-level pyramid diagram
 Directional Maps
Directional Maps solution extends ConceptDraw PRO software with templates, samples and libraries of vector stencils for drawing the directional, location, site, transit, road and route maps, plans and schemes.
 Bar Graphs
The Bar Graphs solution enhances ConceptDraw PRO v10 functionality with templates, numerous professional-looking samples, and a library of vector stencils for drawing different types of Bar Graphs, such as Simple Bar Graph, Double Bar Graph, Divided Bar Graph, Horizontal Bar Graph, Vertical Bar Graph, and Column Bar Chart.
HelpDesk
How to Create a Bar Chart in ConceptDraw PRO

Bar charts are widely used to show and compare the values of the same parameters for different data groups.
The bar graph can be vertical or horizontal. This depends on the amount of categories. There are many methods in which bar graph can be built and this makes it a very often used chart type. Usually, a bar chart is created so that the bars are placed vertically. Such arrangement means that the bar's height value is proportional to the category value. Nevertheless, a bar chart can be also drawn horizontally. This means that the longer the bar, the bigger the category. Thus, a bar chart is a good way to present the relative values of different measured items. The ConceptDraw Bar Graphs solution allows you to draw a bar chart quickly using a vector library, containing the set of various bar charts objects.
HelpDesk
How to Draw a Histogram in ConceptDraw PRO

HelpDesk
How to Draw a Pyramid Diagram in ConceptDraw PRO

 Pyramid Diagrams
Pyramid Diagrams solution extends ConceptDraw PRO software with templates, samples and library of vector stencils for drawing the marketing pyramid diagrams.
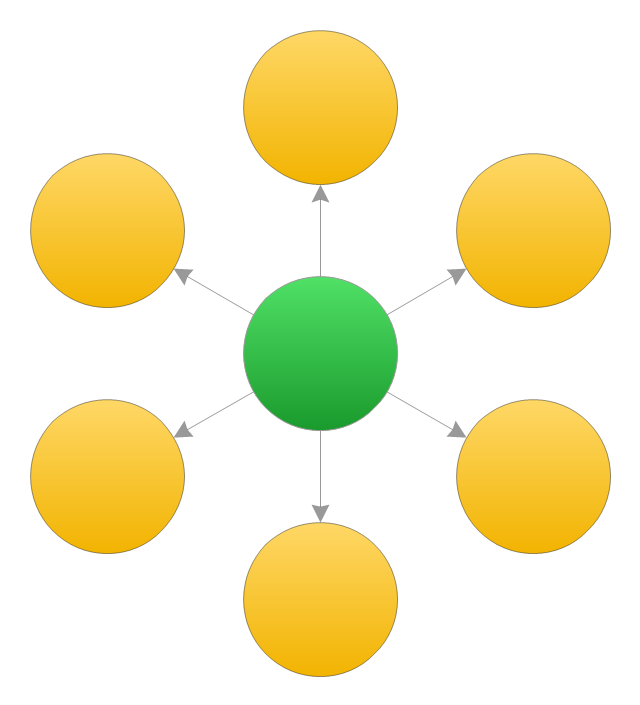
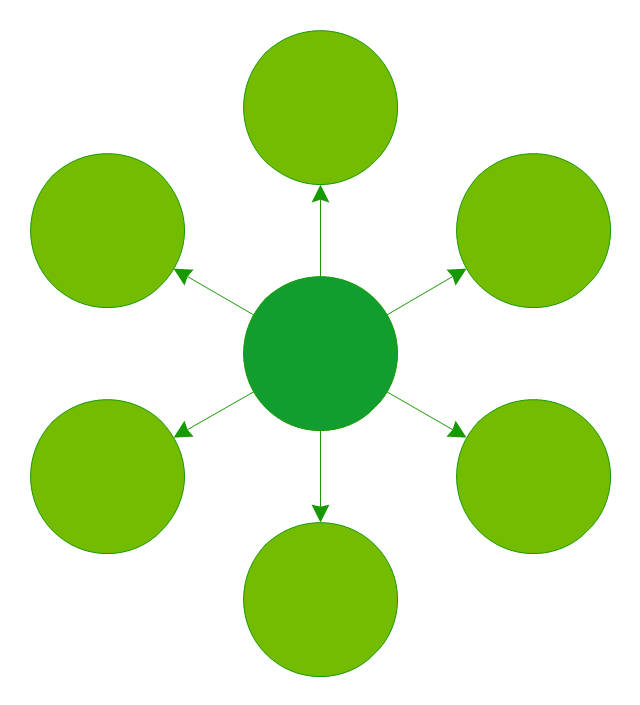
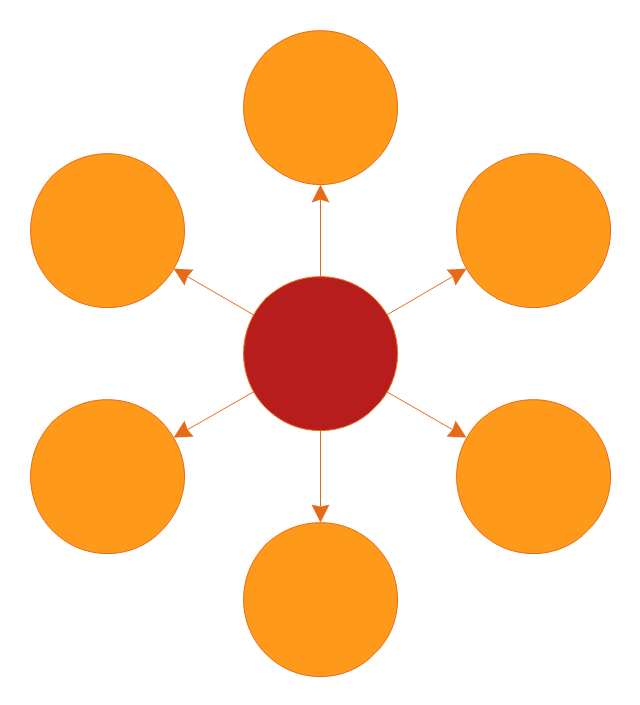
The vector stencils library "Circle-spoke diagram" contains 8 templates of circle-spoke diagrams.
Use these shapes to draw your circle spoke diagrams in the ConceptDraw PRO diagramming and vector drawing software extended with the Circle-Spoke Diagrams solution from the area "What is a Diagram" of ConceptDraw Solution Park.
Use these shapes to draw your circle spoke diagrams in the ConceptDraw PRO diagramming and vector drawing software extended with the Circle-Spoke Diagrams solution from the area "What is a Diagram" of ConceptDraw Solution Park.
Circle-Spoke Diagram 1
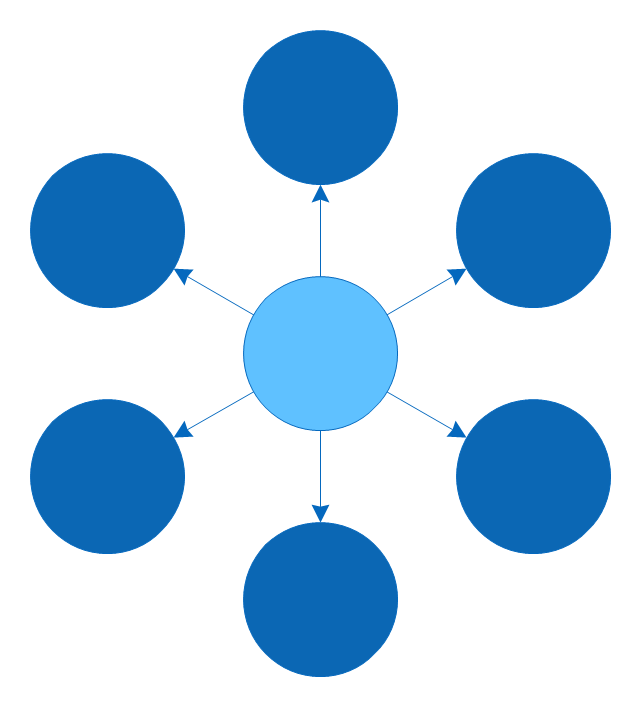
Circle-Spoke Diagram 2
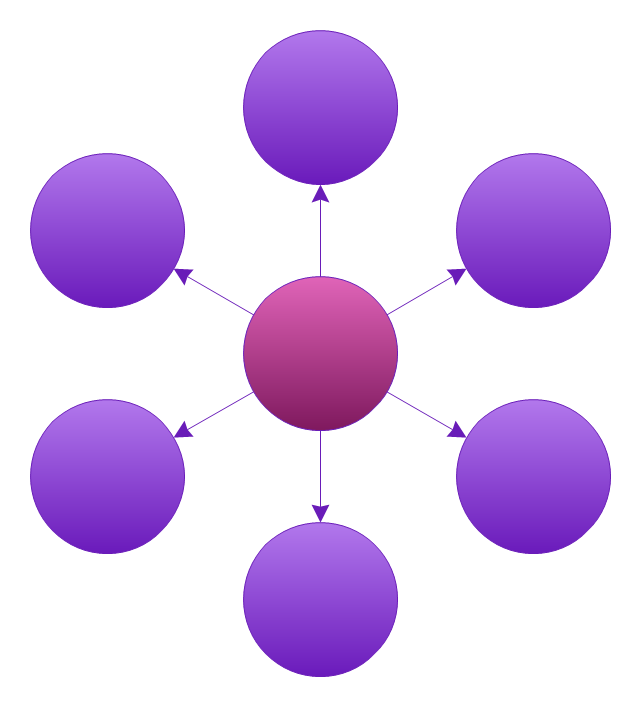
Circle-Spoke Diagram 3
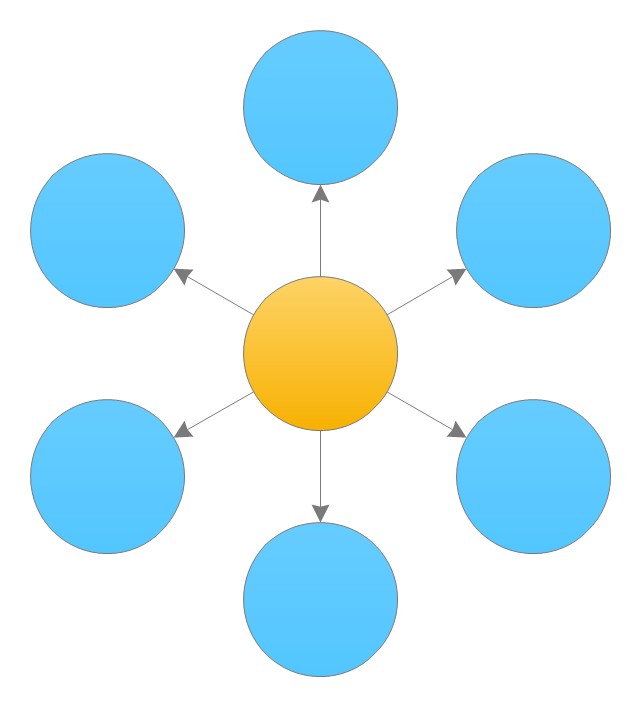
Circle-spoke diagram 4
Circle-Spoke Diagram 5
Circle-Spoke Diagram 6
Circle-Spoke Diagram 7
Circle-Spoke Diagram 8
- Research cycle - Circle diagram | Political map of Central America ...
- Arrowed Circle Png
- Pyramid Template 3d Png
- 3d Vertical Bar Graph
- Network Visualization with ConceptDraw PRO | Computer and ...
- Circular diagrams - Vector stencils library | Best Vector Drawing ...
- 3D Column chart - Iran internet users per 100 person | Column Chart ...
- Pyramid diagrams - Vector stencils library | 2-Level 3D pyramid ...
- 6 Arrow Circle Vector Png
- Triangle Png
- 3D Column chart - Iran internet users per 100 person | Bar Graphs ...
- Plane geometry - Vector stencils library | Geometric Triangle Png
- 6-Level 3D pyramid diagram - Template | Pyramid diagrams - Vector ...
- ConceptDraw Solution Park is an online collection of professional ...
- 2-Level 3D pyramid diagram - Template | Tree Network Topology ...
- Organizational culture - Triangle diagram | Pyramid Diagram | Matrix ...
- Circular diagrams - Vector stencils library | Status indicators - Vector ...
- Time Vector Png High Quality
- Analysis Png
- 3d Triangular Pyramid
- ERD | Entity Relationship Diagrams, ERD Software for Mac and Win
- Flowchart | Basic Flowchart Symbols and Meaning
- Flowchart | Flowchart Design - Symbols, Shapes, Stencils and Icons
- Flowchart | Flow Chart Symbols
- Electrical | Electrical Drawing - Wiring and Circuits Schematics
- Flowchart | Common Flowchart Symbols
- Flowchart | Common Flowchart Symbols