How to Create a Pyramid Diagram

Pyramid Diagram

Pyramid Diagram

 Pyramid Diagrams
Pyramid Diagrams solution extends ConceptDraw DIAGRAM software with templates, samples and library of vector stencils for drawing the marketing pyramid diagrams.
Pyramid Diagram and Pyramid Chart

Pyramid Diagram

How to Create a Column Chart

Pyramid Diagram

Concept Map

How to draw a Concept Map quick, easy and effective? ConceptDraw DIAGRAM offers the unique Concept Maps Solution from the "Diagrams" Area that will help you!
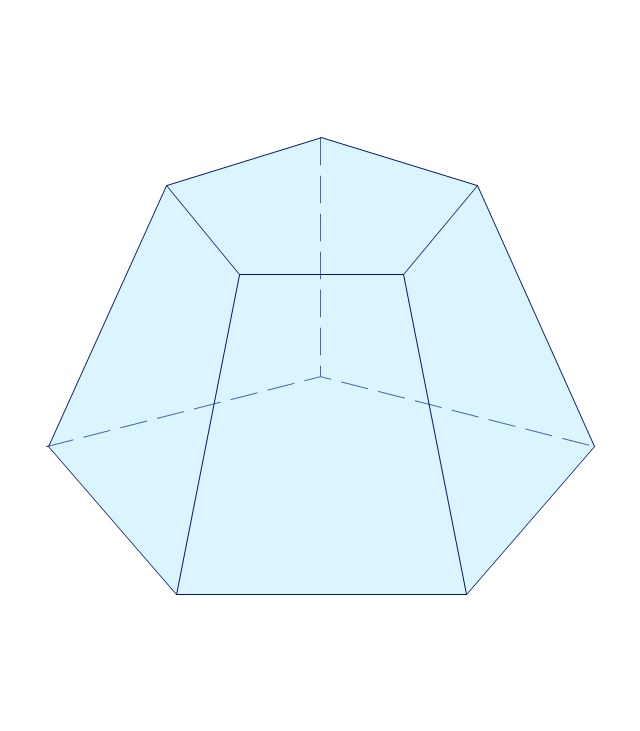
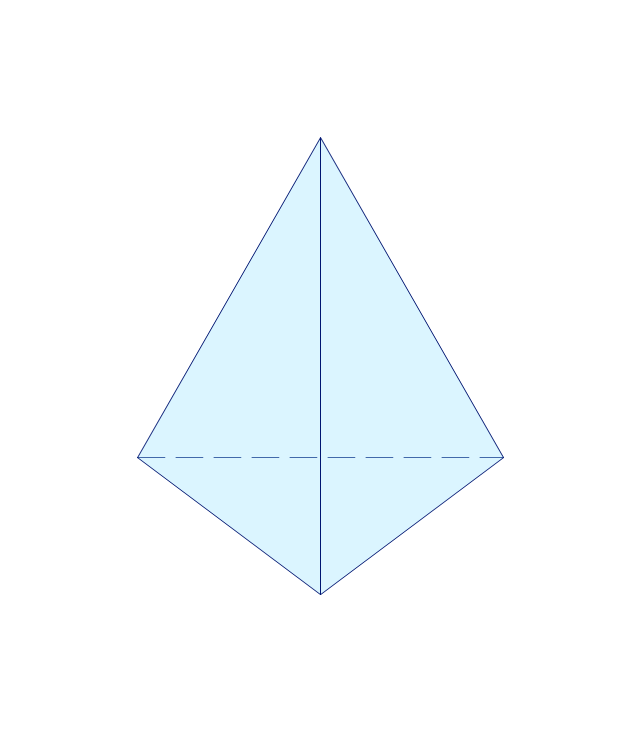
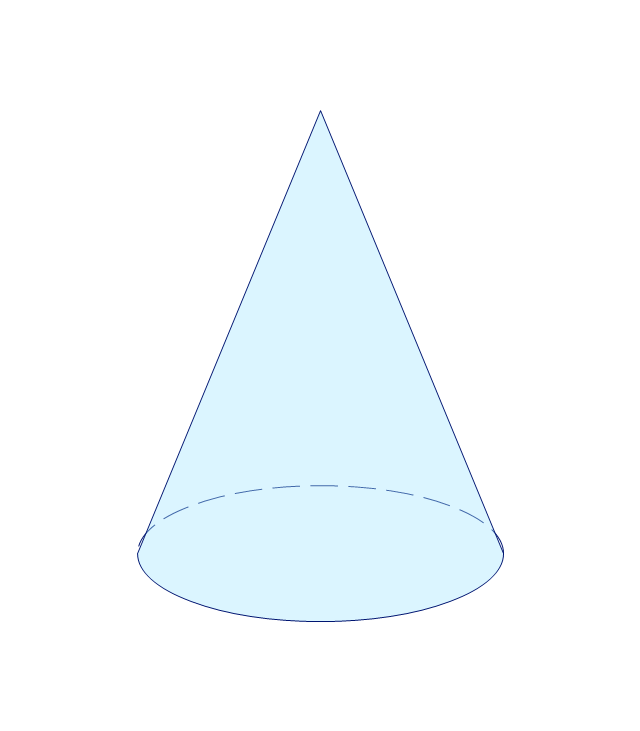
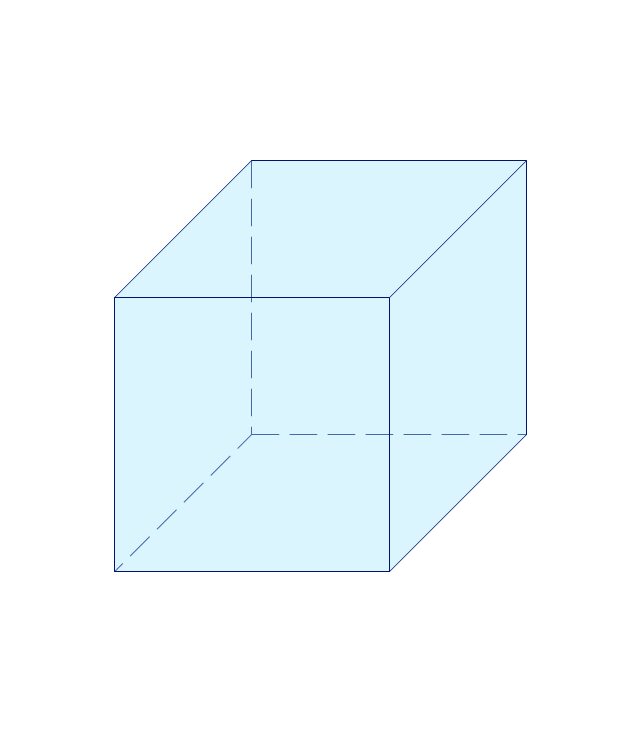
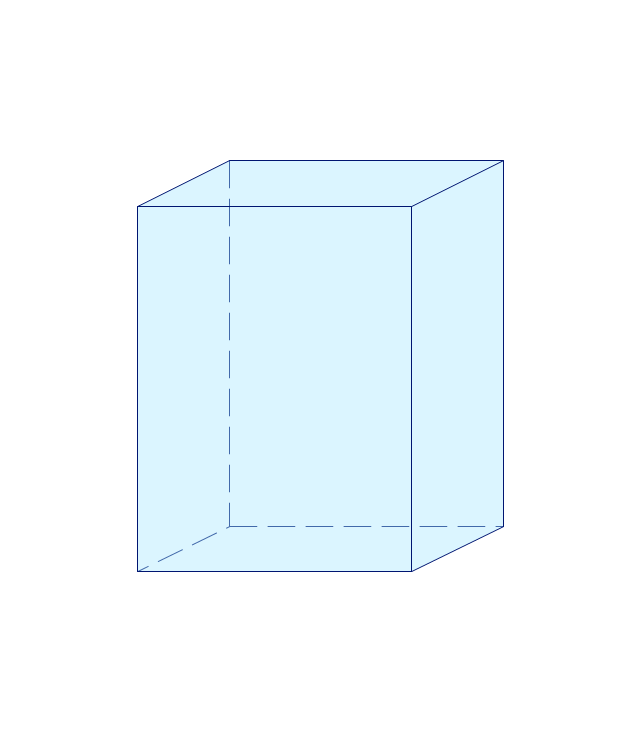
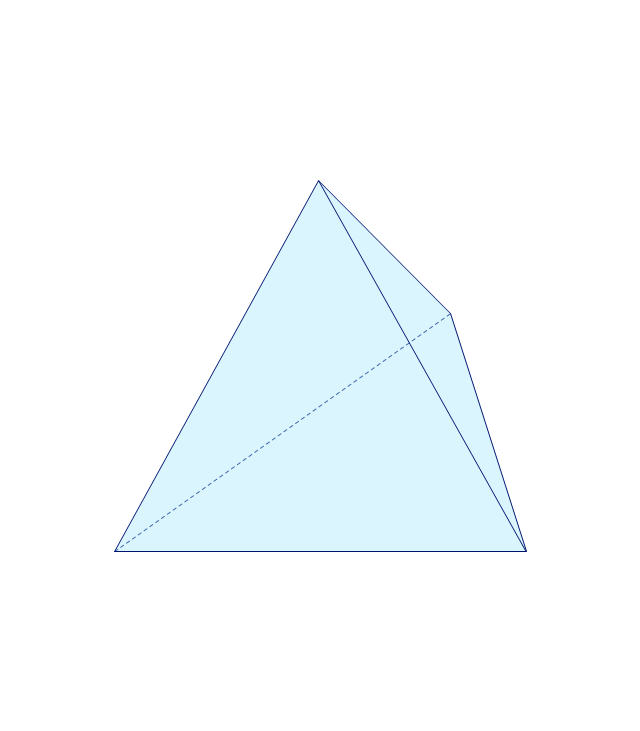
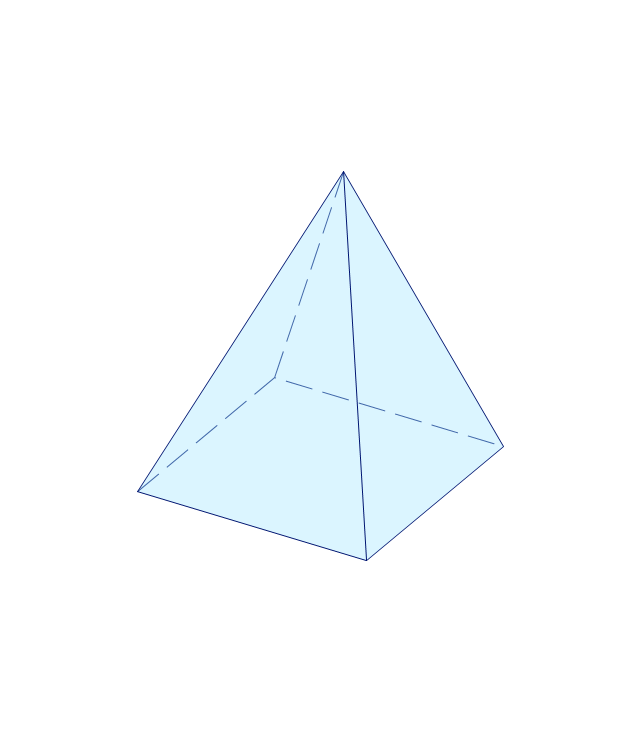
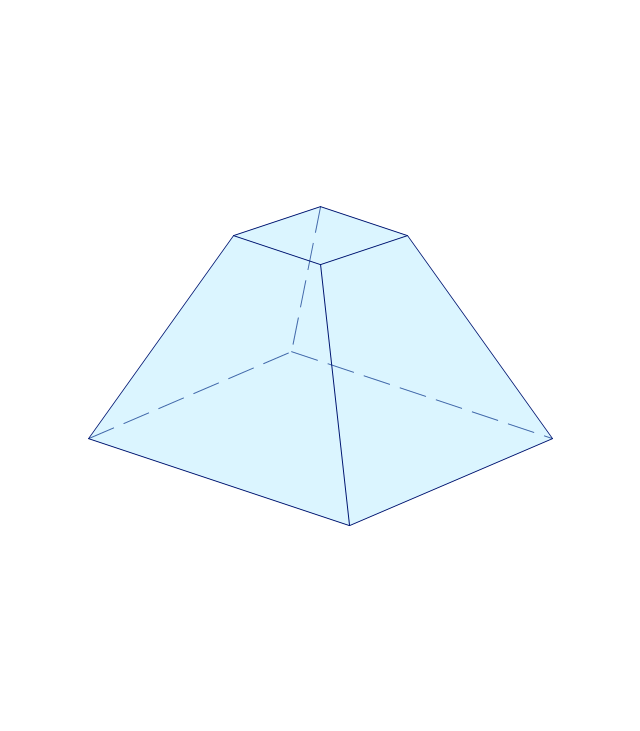
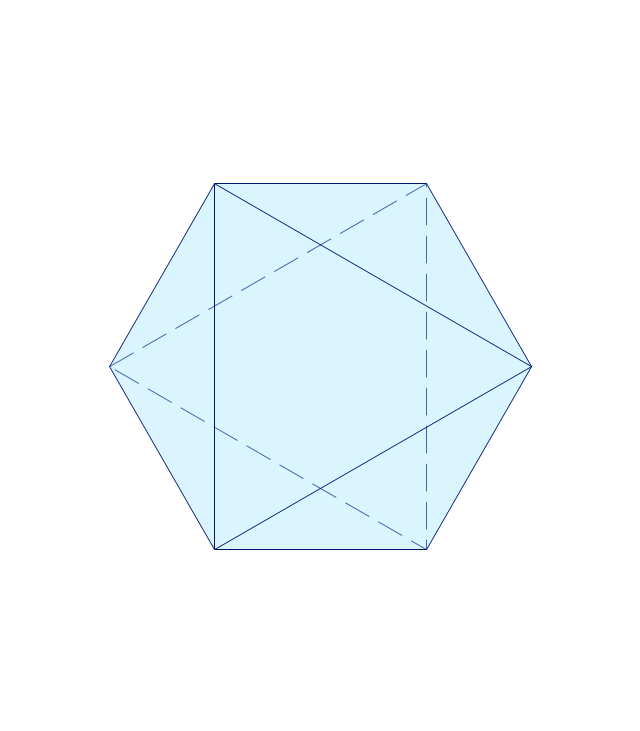
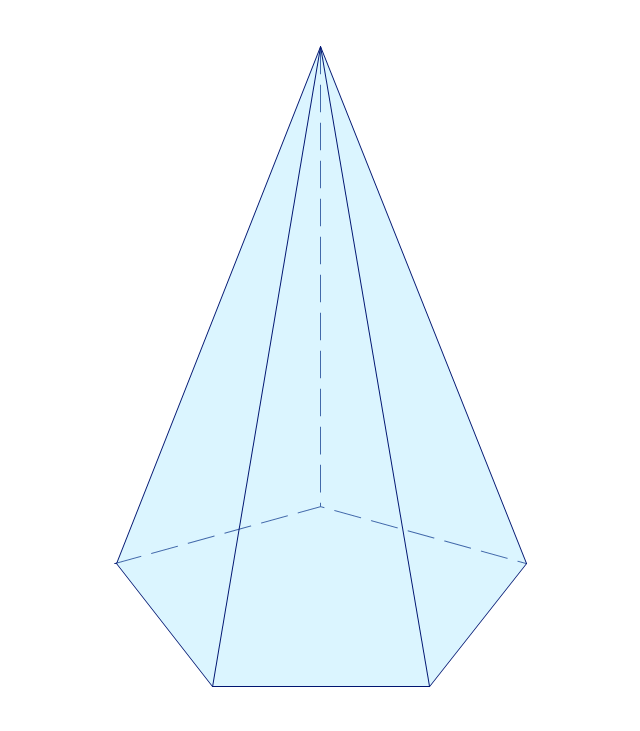
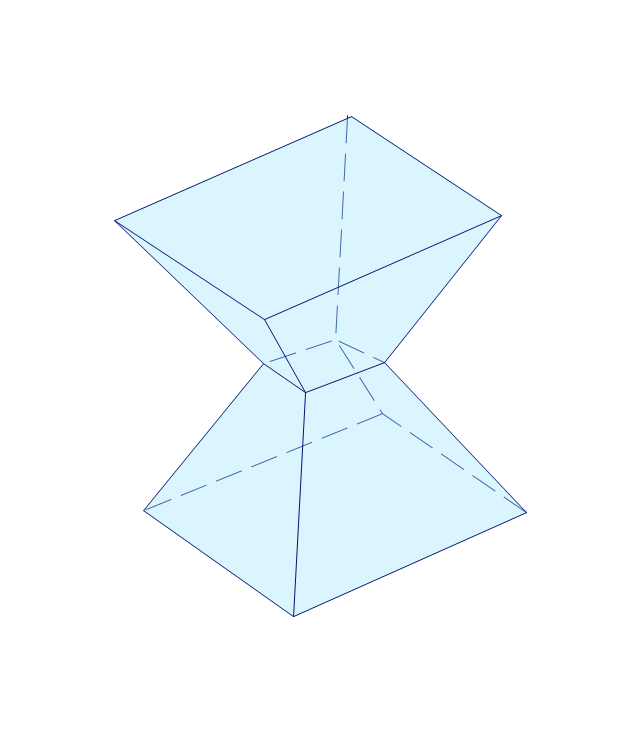
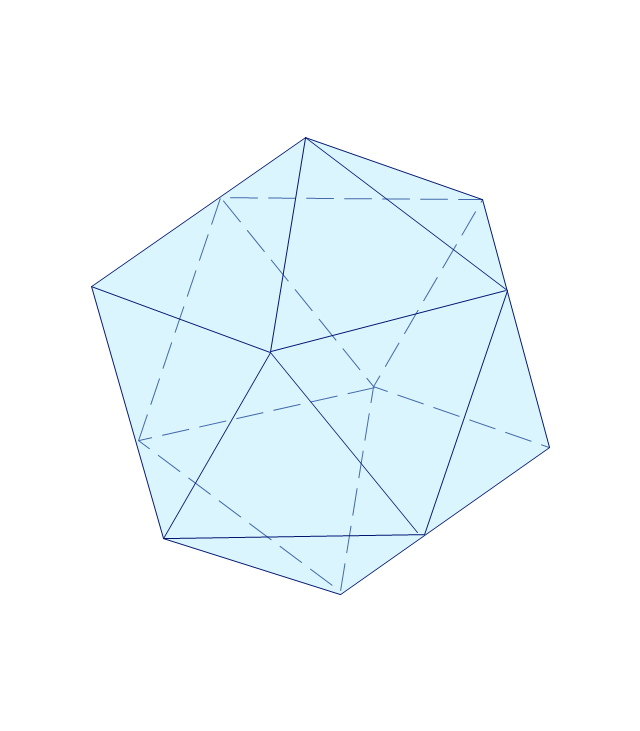
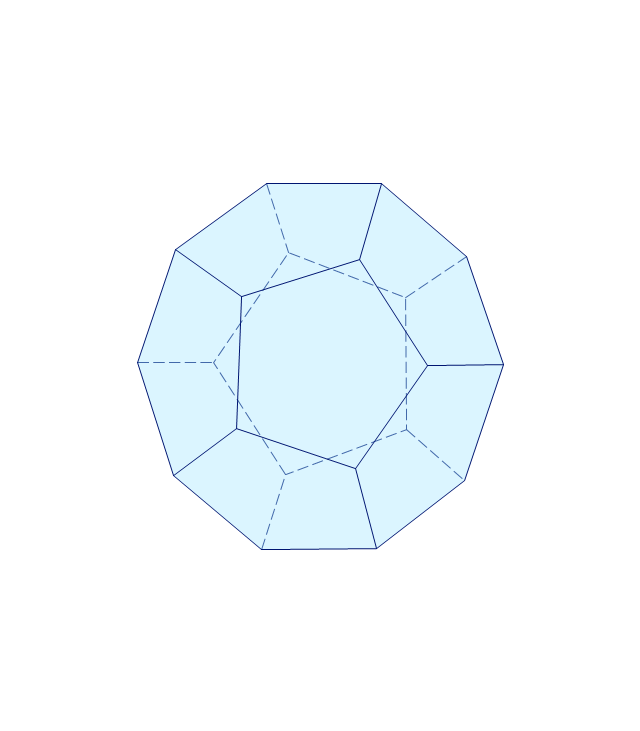
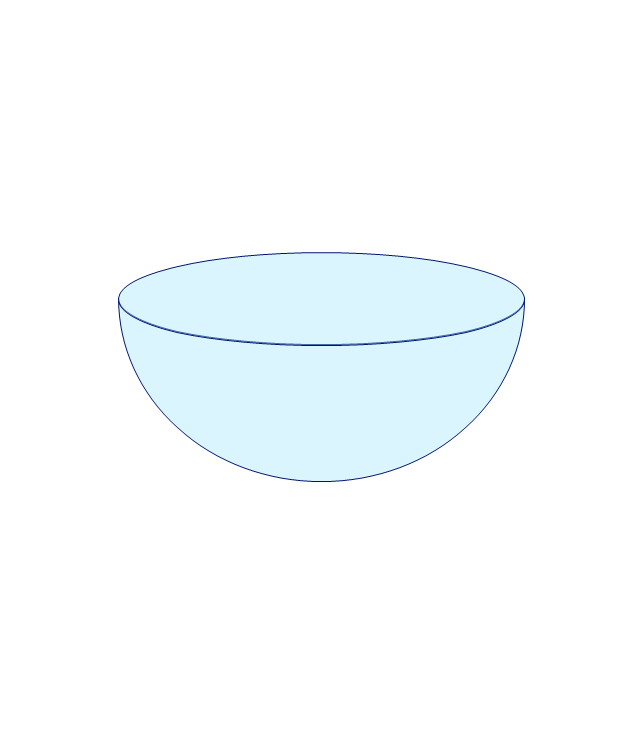
The vector stencils library "Solid geometry" contains 15 shapes of solid geometric figures.
Use these shapes to draw your geometrical diagrams and illustrations in the ConceptDraw PRO diagramming and vector drawing software extended with the Mathematics solution from the Science and Education area of ConceptDraw Solution Park.
Use these shapes to draw your geometrical diagrams and illustrations in the ConceptDraw PRO diagramming and vector drawing software extended with the Mathematics solution from the Science and Education area of ConceptDraw Solution Park.
Conical frustum

Pentagonal frustum
Tetrahedron
Cone
Cube
Rectangular cuboid
Regular tetrahedron
Square pyramid
Square frustum
Octahedron
Pentagonal pyramid
Irregular polyhedron
Icosahedron
Dodecahedron
Hemisphere
IDEF0 Flowchart Symbols

Column Chart Software

Pie Chart Examples and Templates

Pie chart examples and templates created using ConceptDraw DIAGRAM software helps you get closer with pie charts and find pie chart examples suite your needs.
Organizational Chart Templates

Use the Organizational Charts Solution for ConceptDraw DIAGRAM to create your own Organizational Charts of any complexity quick, easy and effective.
The Organizational Charts designed with ConceptDraw DIAGRAM are vector graphic documents and are available for reviewing, modifying, converting to a variety of formats (image, HTML, PDF file, MS PowerPoint Presentation, Adobe Flash or MS Visio XML), printing and send via e-mail in one moment.

 Block Diagrams
Block diagrams solution extends ConceptDraw DIAGRAM software with templates, samples and libraries of vector stencils for drawing the block diagrams.
 Computer Network Diagrams
Computer Network Diagrams solution extends ConceptDraw DIAGRAM software with samples, templates and libraries of vector icons and objects of computer network devices and network components to help you create professional-looking Computer Network Diagrams, to plan simple home networks and complex computer network configurations for large buildings, to represent their schemes in a comprehensible graphical view, to document computer networks configurations, to depict the interactions between network's components, the used protocols and topologies, to represent physical and logical network structures, to compare visually different topologies and to depict their combinations, to represent in details the network structure with help of schemes, to study and analyze the network configurations, to communicate effectively to engineers, stakeholders and end-users, to track network working and troubleshoot, if necessary.
 Funnel Diagrams
Funnel Diagrams solution including wide range of funnel diagram samples, sales funnel examples, and vector design elements, makes the ConceptDraw DIAGRAM ideal for funnel management and creation the Funnel Diagrams of different types and designs, AIDA Model, AIDAS, ACCA Dagmar, Rossiter-Percy Model, Sales funnel, Marketing funnel, Search funnel, Brand funnel, Purchase funnel, Lead funnel, Conversion funnel, Business funnel, etc. You are free to choose to place your funnel object horizontally or vertically, you can use the objects with desired quantity of sales funnel stages, as well as to modify their size, color filling, and other parameters to make exceptionally looking Funnel diagrams fully responding to your desires.
This vector stencils library contains 195 cloud computing icons.
Use it to design cloud computing infographic and diagrams with ConceptDraw PRO software.
"Cloud computing, also on-demand computing, is a kind of Internet-based computing that provides shared processing resources and data to computers and other devices on demand. It is a model for enabling ubiquitous, on-demand access to a shared pool of configurable computing resources (e.g., networks, servers, storage, applications and services), which can be rapidly provisioned and released with minimal management effort. Cloud computing and storage solutions provide users and enterprises with various capabilities to store and process their data in third-party data centers.
Cloud computing has become a highly demanded service or utility due to the advantages of high computing power, cheap cost of services, high performance, scalability, accessibility as well as availability." [Cloud computing. Wikipedia]
The vector stencils library "Cloud clipart" is included in the Cloud Computing Diagrams solution from the Computer and Networks area of ConceptDraw Solution Park.
Access point

Airport

Alert

Banknote

Banknote bundle

Banknote bundles

Backup

Bar chart

Big data

Book (closed)
-cloud-clipart---vector-stencils-library.png--diagram-flowchart-example.png)
Book (open)
-cloud-clipart---vector-stencils-library.png--diagram-flowchart-example.png)
Books

Box, close

Box, open

Braces

Brackets

Bug

Building

Bus

Cable connection

Calculator

Calendar

Car

CD/DVD

Check list

Check mark

Clock

Cloud

Cloud computing

Cloud database

Cloud hosting

Cloud storage

Code

Coffee cup

Coin

Coins stack

Coins stacks

Communication

Computer terminal

Console

CPU

Credit card

Cubes

Dashboard

Database

Databases

Datacenter

Dialog box

Dialog boxes

Document

Documents

Dollar sign

Download

Earth

Email

Equal sign

Ethernet jack

Ethernet plug

Euro sign

Exclamation mark

Eye

Feed symbol

Feedback

File

Files

Filter

Firewall

Flash drive

Folder

Folders

Gamepad

Gauge

Gear

Gears, 2

Gears, 3

Globe

Hacker

Hard drive

Heart

Heart rhythm

Home

Hosting

Hotel

House

Image

Info

IP phone

Jet

Key

Keyboard

Laptop

Lego

Letter

Light bulb

Lightning

Line chart

Linux penguin

List

Load balancer

Location mark

Lock, close

Lock, open

Lock and key

Log

Login

Logout

Magnifying glass

Mail

Map

Memory (RAM)
-cloud-clipart---vector-stencils-library.png--diagram-flowchart-example.png)
Microphone

Minus sign

Mobile phone

Monitor

Mouse

Movie

Music

Music player

Network

Network bus

Newspaper

NIC (Network interface controller)
-cloud-clipart---vector-stencils-library.png--diagram-flowchart-example.png)
Not found (Error 404)
-cloud-clipart---vector-stencils-library.png--diagram-flowchart-example.png)
Notebook

Office printer

Operator

Page

Pages

PC

Pencil

Photo

Photo camera

Pie chart

Platform

Plus sign

Pound sign

Printer

Puzzle

Puzzles, 2x2

Puzzles, 3x3

Question sign

Rackmount server

Router

Safe

Satellite

Satellite antenna

Schedule

Sensor

Server

Server rack

Shield

Ship

Shopping bag

Shopping basket

Shopping cart

Sign up

Smartphone

Social network

Software box

Sound

Spider

Spreadsheet

SSD

Star

Stars, 5

Stethoscope

Stickman

Stickmen

Suitcase

Support

Switch

Syringe

Tablet computer

Tools

Train

Truck

Truck 2

TV

Umbrella

Upload

User man

User woman

User profile

Video

Video camera

Video mail

Virtual disk

Virus

Wallet

Web camera

Wifi antenna

Wireless

Wrench

X cross symbol

Yen sign

Cross-Functional Flowchart

Use cross-functional flowcharts to show the relationship between a business process and the functional units (such as departments) responsible for that process. To create it use the best flowchart maker of ConceptDraw DIAGRAM.

 Flowcharts
The Flowcharts solution for ConceptDraw DIAGRAM is a comprehensive set of examples and samples in several varied color themes for professionals that need to represent graphically a process. Solution value is added by the basic flow chart template and shapes' libraries of flowchart notation. ConceptDraw DIAGRAM flow chart creator lets one depict the processes of any complexity and length, as well as design the Flowchart either vertically or horizontally.
- 4 Level pyramid model diagram - Information systems types | 5 Level ...
- Types of Flowcharts | Pyramid Diagram | Flowchart design ...
- Entity Relationship Diagram Symbols | ERD Symbols and Meanings ...
- 5 Level pyramid model diagram - Information systems types ...
- 3D Network Diagram Software | Directional Maps | How to Draw a ...
- Pyramid diagrams - Vector stencils library | Pyramid Charts | Solid ...
- Pyramid Diagram
- Pyramid Diagram | Account Flowchart Stockbridge System ...
- Flow Chart Symbols | Pyramid Diagram | Organizational Charts with ...
- Pyramid Diagram | Pyramid Diagram | Types of Flowcharts | Briefly ...
- Healthy Foods | Pyramid Diagrams | Flowchart design. Flowchart ...
- Prism Geometric Shape
- Pyramid Diagram | Pyramid Diagram | Types of Flowcharts | Phrymid ...
- Flowchart design. Flowchart symbols, shapes , stencils and icons ...
- Pyramid Diagram | Types of Flowcharts | Pyramid Diagram | Models ...
- Pyramid diagrams - Vector stencils library | Vector stencils library ...
- Pyramid Diagram | Types of Flowcharts | Data Flow Diagram (DFD ...
- Flowchart design. Flowchart symbols, shapes , stencils and icons ...
- Design elements - Solid geometry | How to Draw Geometric Shapes ...
- Process Flow Diagram Symbols | Types of Flowcharts | Flowchart ...
- ERD | Entity Relationship Diagrams, ERD Software for Mac and Win
- Flowchart | Basic Flowchart Symbols and Meaning
- Flowchart | Flowchart Design - Symbols, Shapes, Stencils and Icons
- Flowchart | Flow Chart Symbols
- Electrical | Electrical Drawing - Wiring and Circuits Schematics
- Flowchart | Common Flowchart Symbols
- Flowchart | Common Flowchart Symbols