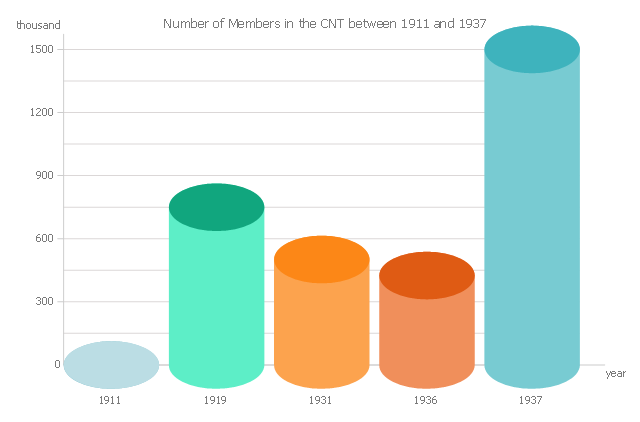
This 3D bar chart sample shows the number of members in the Confederación Nacional del Trabajo (CNT, National Confederation of Labour) between 1911 and 1937. It was designed on the base of the Commons Wikimedia file: Cnt afiliats.png.
[commons.wikimedia.org/ wiki/ File:Cnt_ afiliats.png]
This file is licensed under the Creative Commons Attribution-Share Alike 2.5 Generic license.
[creativecommons.org/ licenses/ by-sa/ 2.5/ deed.en]
"The Confederación Nacional del Trabajo (CNT; "National Confederation of Labour") is a Spanish confederation of anarcho-syndicalist labour unions affiliated with the International Workers Association (IWA; Spanish: AIT – Asociación Internacional de los Trabajadores). When working with the latter group it is also known as CNT-AIT. Historically, the CNT has also been affiliated with the Federación Anarquista Ibérica (Iberian Anarchist Federation – FAI). In this capacity it was referred to as the CNT-FAI. Throughout its history, it has played a major role in the Spanish labor movement.
Founded in 1910 in Barcelona from groups brought together by the trade union Solidaridad Obrera, it significantly expanded the role of anarchism in Spain, which can be traced to the creation of the Federación de Trabajadores de la Región Española, the successor organization to the Spanish chapter of the IWA.
Despite several decades when the organization was illegal in Spain, today the CNT continues to participate in the Spanish worker's movement, focusing its efforts on the principles of workers' self-management, federalism, and mutual aid." [Confederación Nacional del Trabajo. Wikipedia]
The 3D column chart example "Number of Members in the CNT between 1911 and 1937" was created using the ConceptDraw PRO diagramming and vector drawing software extended with the Bar Graphs solution from the Graphs and Charts area of ConceptDraw Solution Park.
3D Bar graph
HelpDesk
How to Create a Bar Chart in ConceptDraw PRO

Bar charts are widely used to show and compare the values of the same parameters for different data groups.
The bar graph can be vertical or horizontal. This depends on the amount of categories. There are many methods in which bar graph can be built and this makes it a very often used chart type. Usually, a bar chart is created so that the bars are placed vertically. Such arrangement means that the bar's height value is proportional to the category value. Nevertheless, a bar chart can be also drawn horizontally. This means that the longer the bar, the bigger the category. Thus, a bar chart is a good way to present the relative values of different measured items. The ConceptDraw Bar Graphs solution allows you to draw a bar chart quickly using a vector library, containing the set of various bar charts objects.
The vector stencils library "Bar charts" contains 7 templates of bar and column charts for visualizing quantitative and statistical data comparison and changes in time series. Drag template from library to your document and enter your data.
Use these shapes to draw your bar graphs in the ConceptDraw PRO diagramming and vector drawing software.
The vector stencils library "Bar charts" is included in the Bar Graphs solution from the Graphs and Charts area of ConceptDraw Solution Park.
Use these shapes to draw your bar graphs in the ConceptDraw PRO diagramming and vector drawing software.
The vector stencils library "Bar charts" is included in the Bar Graphs solution from the Graphs and Charts area of ConceptDraw Solution Park.
Vertical bar chart

Horizontal bar chart

3D bar chart

Cylindrical bar chart

Double bar chart

Column chart - serial

Horizontal bar chart - serial

Coordinate system 3D

The 3D vertical bar graph sample shows the Iran internet users per 100 person from 2000 to 2011. It was designed on the base of the Commons Wikimedia file: Iran internet users per 100 person.png.
[commons.wikimedia.org/ wiki/ File:Iran_ internet_ users_ per_ 100_ person.png]
This file is licensed under the Creative Commons Attribution-Share Alike 3.0 Unported license. [creativecommons.org/ licenses/ by-sa/ 3.0/ deed.en]
The data source is World Bank: [data.worldbank.org/ country/ iran-islamic-republic]
"In 1993 Iran became the second country in the Middle East to be connected to the Internet, and since then the government has made significant efforts to improve the nation's ICT infrastructure. Iran's national Internet connectivity infrastructure is based on two major networks: the public switched telephone network (PSTN) and the public data network. The PSTN provides a connection for end-users to Internet service providers (ISPs) over mostly digital lines and supports modem-based connections. The Data Communication Company of Iran (DCI), a subsidiary of TCI, operates the public data network." [Internet in Iran. Wikipedia]
The 3D column chart example "Iran internet users per 100 person" was created using the ConceptDraw PRO diagramming and vector drawing software extended with the Bar Graphs solution from the Graphs and Charts area of ConceptDraw Solution Park.
3D Column chart

The vector stencils library "Bar charts" contains 7 templates of bar and column charts for visualizing quantitative and statistical data comparison and changes in time series. Drag template from library to your document and enter your data.
Use these shapes to draw your bar graphs in the ConceptDraw PRO diagramming and vector drawing software.
The vector stencils library "Bar charts" is included in the Bar Graphs solution from the Graphs and Charts area of ConceptDraw Solution Park.
Use these shapes to draw your bar graphs in the ConceptDraw PRO diagramming and vector drawing software.
The vector stencils library "Bar charts" is included in the Bar Graphs solution from the Graphs and Charts area of ConceptDraw Solution Park.
Vertical bar chart
Horizontal bar chart
3D bar chart
Cylindrical bar chart
Double bar chart
Column chart - serial
Horizontal bar chart - serial
Coordinate system 3D
How to Create a Bar Chart

The vector stencils library "Bar charts" contains 7 templates of bar and column charts for visualizing quantitative and statistical data comparison and changes in time series. Drag template from library to your document and enter your data.
Use these shapes to draw your bar graphs in the ConceptDraw PRO diagramming and vector drawing software.
The vector stencils library "Bar charts" is included in the Bar Graphs solution from the Graphs and Charts area of ConceptDraw Solution Park.
Use these shapes to draw your bar graphs in the ConceptDraw PRO diagramming and vector drawing software.
The vector stencils library "Bar charts" is included in the Bar Graphs solution from the Graphs and Charts area of ConceptDraw Solution Park.
Vertical bar chart
Horizontal bar chart
3D bar chart
Cylindrical bar chart
Double bar chart
Column chart - serial
Horizontal bar chart - serial
Coordinate system 3D
 Bar Graphs
The Bar Graphs solution enhances ConceptDraw PRO v10 functionality with templates, numerous professional-looking samples, and a library of vector stencils for drawing different types of Bar Graphs, such as Simple Bar Graph, Double Bar Graph, Divided Bar Graph, Horizontal Bar Graph, Vertical Bar Graph, and Column Bar Chart.
How to Create a Column Chart

The vector stencils library "Bar charts" contains 7 templates of bar and column charts for visualizing quantitative and statistical data comparison and changes in time series. Drag template from library to your document and enter your data.
Use these shapes to draw your bar graphs in the ConceptDraw PRO diagramming and vector drawing software.
The vector stencils library "Bar charts" is included in the Bar Graphs solution from the Graphs and Charts area of ConceptDraw Solution Park.
Use these shapes to draw your bar graphs in the ConceptDraw PRO diagramming and vector drawing software.
The vector stencils library "Bar charts" is included in the Bar Graphs solution from the Graphs and Charts area of ConceptDraw Solution Park.
Vertical bar chart
Horizontal bar chart
3D bar chart
Cylindrical bar chart
Double bar chart
Column chart - serial
Horizontal bar chart - serial
Coordinate system 3D
- 3D Bar graph - Number of Members in the CNT between 1911 and ...
- How to Create a Bar Chart in ConceptDraw PRO | 3D Column chart ...
- 3D Column chart - Iran internet users per 100 person | Bar Graphs ...
- 3D Bar graph - Number of Members in the CNT between 1911 and ...
- 3d Bar Graph Horizontal Png
- 3D bar chart
- Bar Graphs | Column Chart Software | Bar Chart Software | 3d ...
- Bar charts - Vector stencils library
- Floor Plan Bar 3d
- 3 D Model On Double Bar Graph
- ERD | Entity Relationship Diagrams, ERD Software for Mac and Win
- Flowchart | Basic Flowchart Symbols and Meaning
- Flowchart | Flowchart Design - Symbols, Shapes, Stencils and Icons
- Flowchart | Flow Chart Symbols
- Electrical | Electrical Drawing - Wiring and Circuits Schematics
- Flowchart | Common Flowchart Symbols
- Flowchart | Common Flowchart Symbols