 Windows 10 User Interface
Windows 10 User Interface solution extends significantly ConceptDraw PRO v11 functionality with look-and-feel functions of GUI software and makes it a great assistant for Win10 designers, developers, and software engineers. This solution provides a wide s
HelpDesk
How to Design a Mockup of Windows 10 User Interface

UML in 10 mins

This sample describes the credit card processing system. It’s a UML Class Diagram with generalization sets. This sample can be used by the banks, business and financial companies, exchanges.
How To Create a Presentation for 10 Minutes

This example was designed on the base of the cybersecurity infographic from the website gov.uk. (Open Government Licence v3.0. nationalarchives.gov.uk/ doc/ open-government-licence/ version/ 3/ )
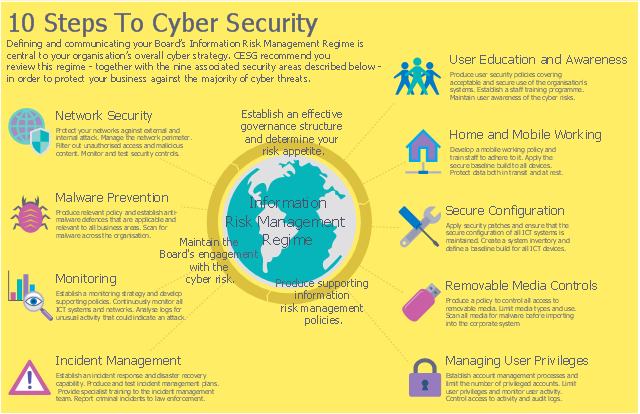
"10 Steps To Cyber Security...
Defining and communicating your Board’s Information Risk Management Regime (shown at the centre of the following diagram) is central to your organisation’s overall cyber strategy.
... the 9 steps that surround it are ...
- Secure configuration
- Network security
- Managing user privileges
- User education and awareness
- Incident management
- Malware prevention
- Monitoring
- Removable media controls
- Home and mobile working" [gov.uk/ government/ publications/ cyber-risk-management-a-board-level-responsibility/ 10-steps-summary]
The infographic example "10 Steps to Cyber Security" was created using the ConceprDraw PRO software extended with the Network Security Diagrams solution from the Computer and Neworks area of ConceptDraw Solution Park.
Computer security infographic
Used Solutions
HelpDesk
Downloading the Old Versions of ConceptDraw Products

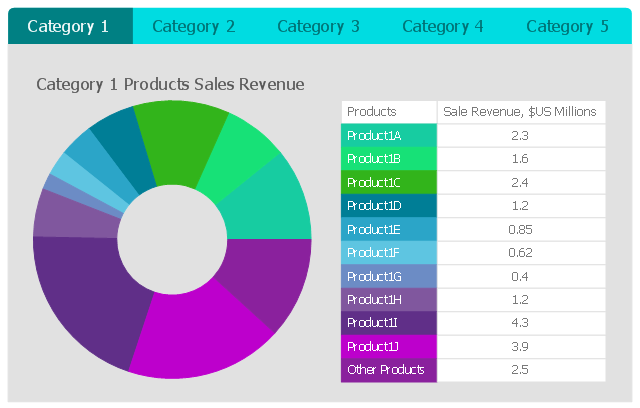
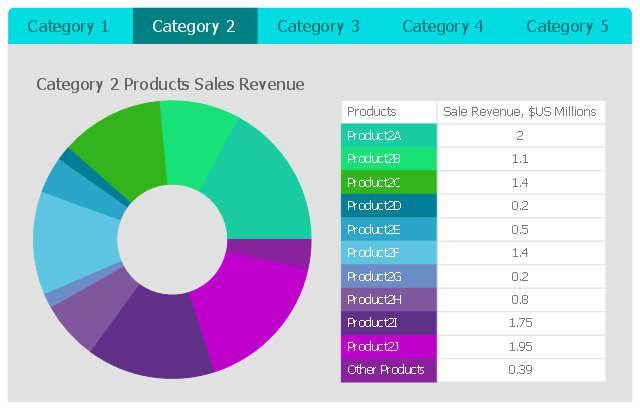
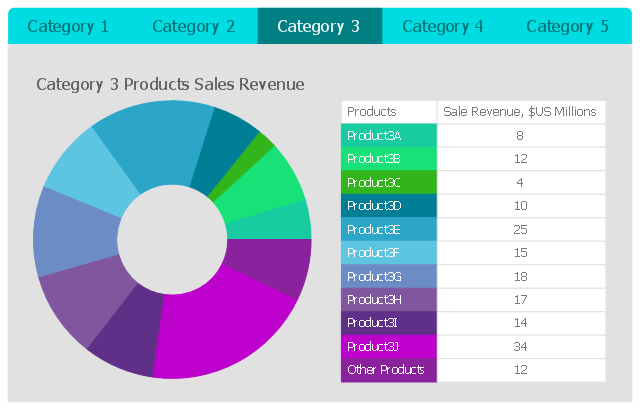
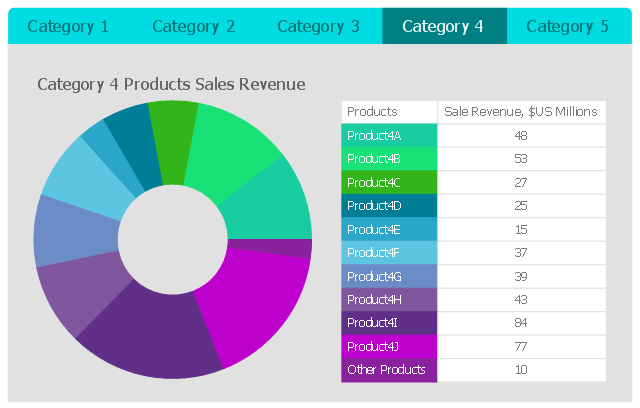
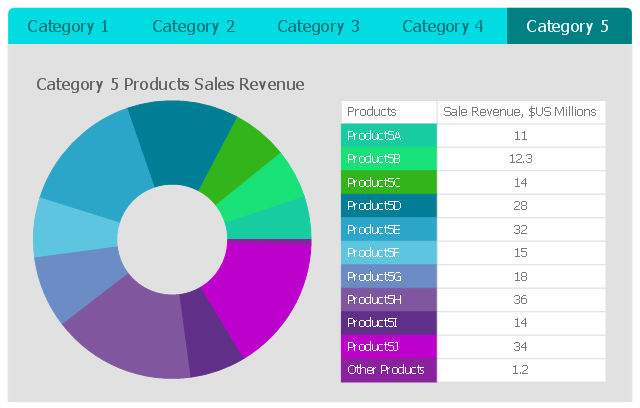
This business intelligence dashboard sample shows the quarter sales revenue for top 10 products by categories using donut charts.
"A doughnut chart (also spelled donut) is a variant of the pie chart, with a blank center allowing for additional information about the data as a whole to be included." [Pie chart. Wikipedia]
The BI dashboard example "Quarter Sales Revenue for Top 10 Products by Categories" was created using ConceptDraw PRO software extended with the Business Intelligence Dashboards solution from the Business Processes area of ConceptDraw Solution Park.
Category 1
Category 2
Category 3
Category 4
Category 5
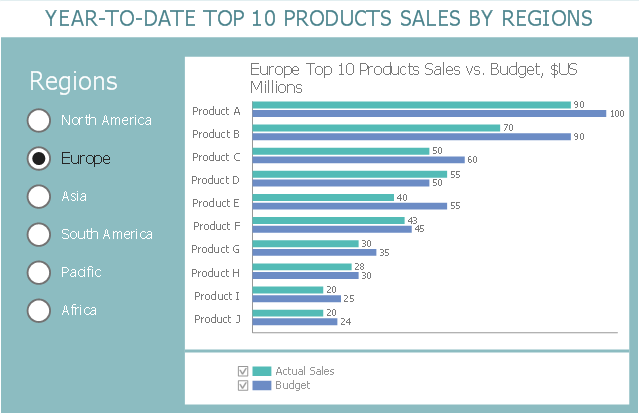
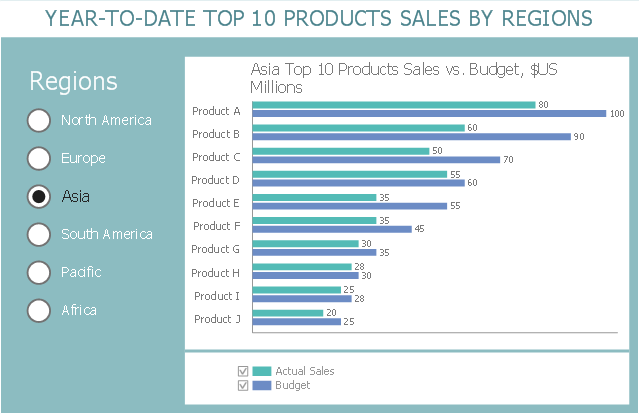
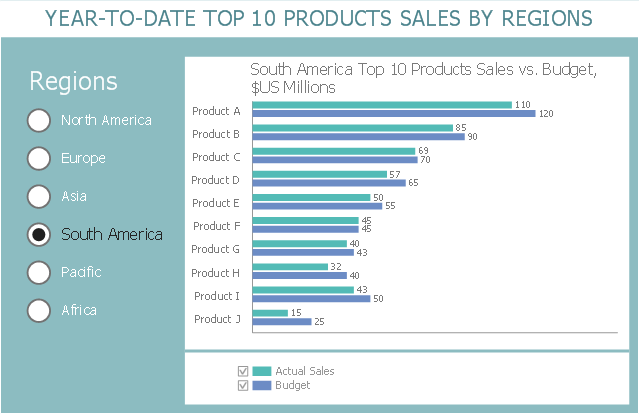
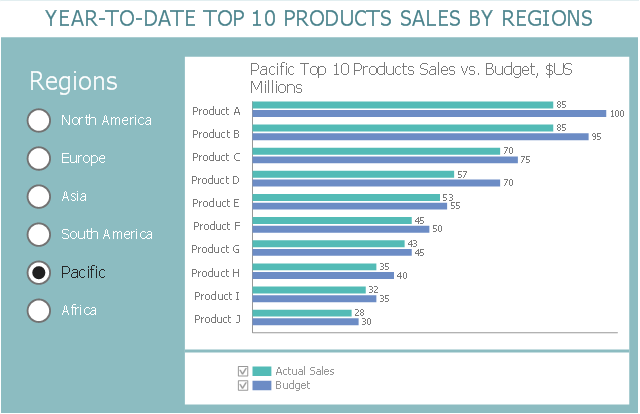
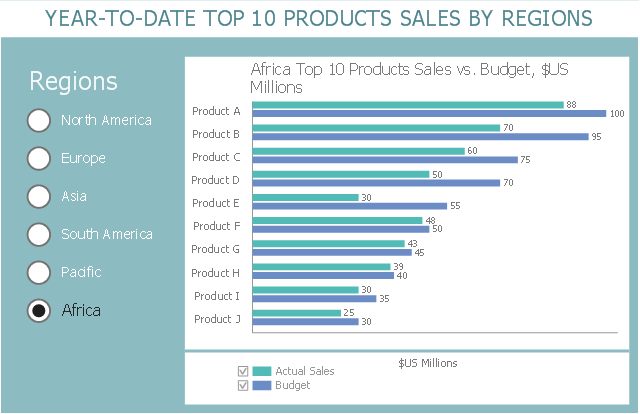
This business intelligence dashboard sample shows the year-to-date top 10 products sales by regions using horizontal bar charts.
"Dashboards often provide at-a-glance views of KPIs (key performance indicators) relevant to a particular objective or business process (e.g. sales, marketing, human resources, or production). In real-world terms, "dashboard" is another name for "progress report" or "report."" [Dashboard (business). Wikipedia]
The BI dashboard example "Year-to-date Top 10 Products Sales by Regions" was created using ConceptDraw PRO software extended with the Business Intelligence Dashboards solution from the Business Processes area of ConceptDraw Solution Park.
North America

Europe
Asia
South America
Pacific
Africa
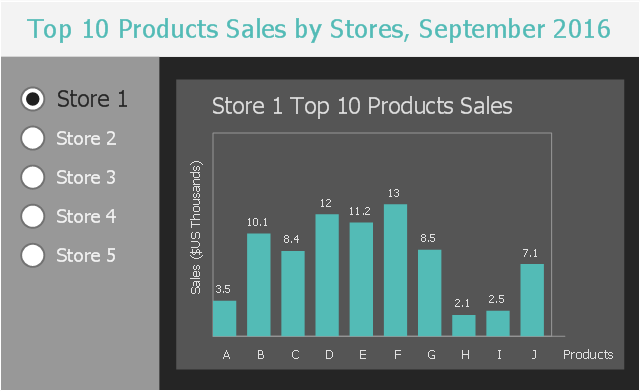
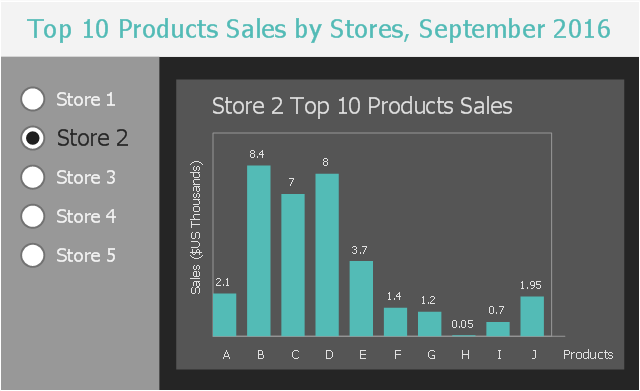
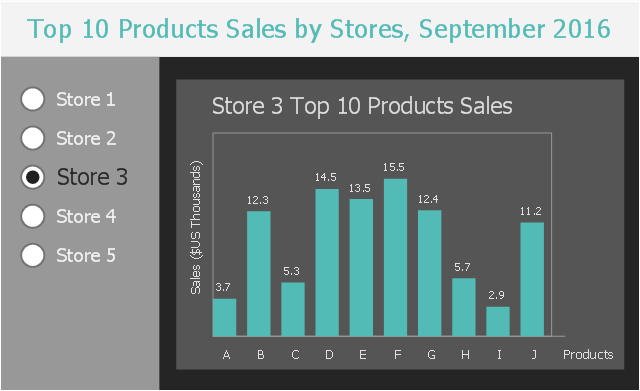
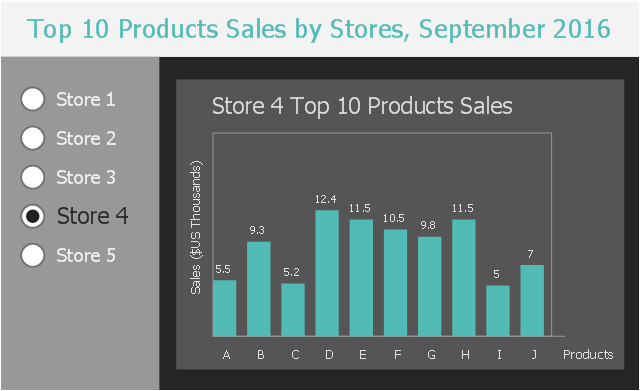
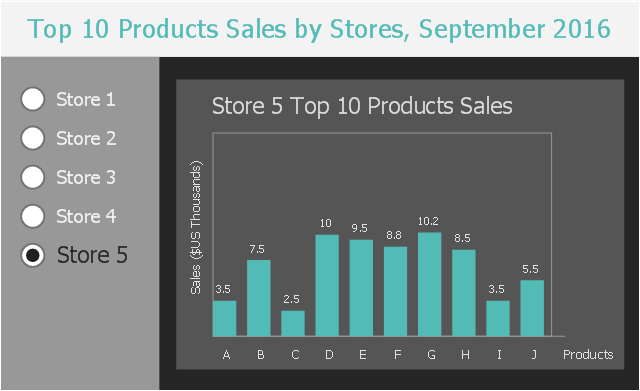
This business intelligence dashboard sample shows the top 10 products sales by stores in September, 2016 using vertical bar charts.
"Bar graphs/ charts provide a visual presentation of categorical data. Categorical data is a grouping of data into discrete groups, such as months of the year, age group, shoe sizes, and animals. These categories are usually qualitative. In a column bar chart, the categories appear along the horizontal axis; the height of the bar corresponds to the value of each category." [Bar chart. Wikipedia]
The BI dashboard example "Top 10 Products Sales by Stores, September 2016" was created using ConceptDraw PRO software extended with the Business Intelligence Dashboards solution from the Business Processes area of ConceptDraw Solution Park.
Store 1
Store 2
Store 3
Store 4
Store 5
Mini Hotel Floor Plan. Floor Plan Examples

Cross-Functional Flowchart (Swim Lanes)

Use flowchart maker of ConceptDraw PRO enhanced with solutions from ConceptDraw Solution Park to create diagrams to present and explain structures, process flows, logical relationships, networks, design schemes and other visually organized information and knowledge.
Basic Flowchart Symbols and Meaning


- New Windows 10 User Interface Solution for ConceptDraw PRO
- Conceptdraw Pro 10 Free Download
- Windows 10 User Interface | Graphical User Interface Examples ...
- List 10 Examples Of Ict Gadget
- 10 Steps to Cyber Security | Network Security Tips | Network ...
- App icons - Vector stencils library | Ibooks Ios 10 Icon
- UML in 10 mins | ConceptDraw PRO Compatibility with MS Visio ...
- Windows 10 User Interface | App icons - Vector stencils library ...
- List And Explain 10 Ict Gadgets
- 10 Ict Gadgets
- 10 Common Different Types Of Flowcharting Symbols
- iPhone User Interface | App icons - Vector stencils library | Ios 10 ...
- Cyber Security Degrees | 10 Steps to Cyber Security | Network ...
- 10 Steps to Cyber Security | Cloud round icons - Vector stencils ...
- List 10 Ict Based Gadgets And Explain Them
- How to Design a Mockup of Windows 10 User Interface | Graphical ...
- How To Create a Presentation for 10 Minutes | How To Do A Mind ...
- 10 Common Laboratory Apparatus
- UML in 10 mins | Introductory Guide to Rapid UML Solution | UML ...
- Conceptdraw Pro 10 Mac Crack Torrent
- ERD | Entity Relationship Diagrams, ERD Software for Mac and Win
- Flowchart | Basic Flowchart Symbols and Meaning
- Flowchart | Flowchart Design - Symbols, Shapes, Stencils and Icons
- Flowchart | Flow Chart Symbols
- Electrical | Electrical Drawing - Wiring and Circuits Schematics
- Flowchart | Common Flowchart Symbols
- Flowchart | Common Flowchart Symbols