Winter Sports. Illustrations and Visualize Statistics
Sports Statistics Visualization
Visualizing sports statistics becomes as easy as never before with ConceptDraw DIAGRAM software extended with the Winter Sports solution. This solution delivers a complete set of winter sports illustrations, samples and templates you may use to visualize any kind of sports statistics in minutes.
The library objects are scalable vector images that can be easily exported to PDF format, Microsoft PowerPoint, Microsoft Visio, graphic image file, or HTML.
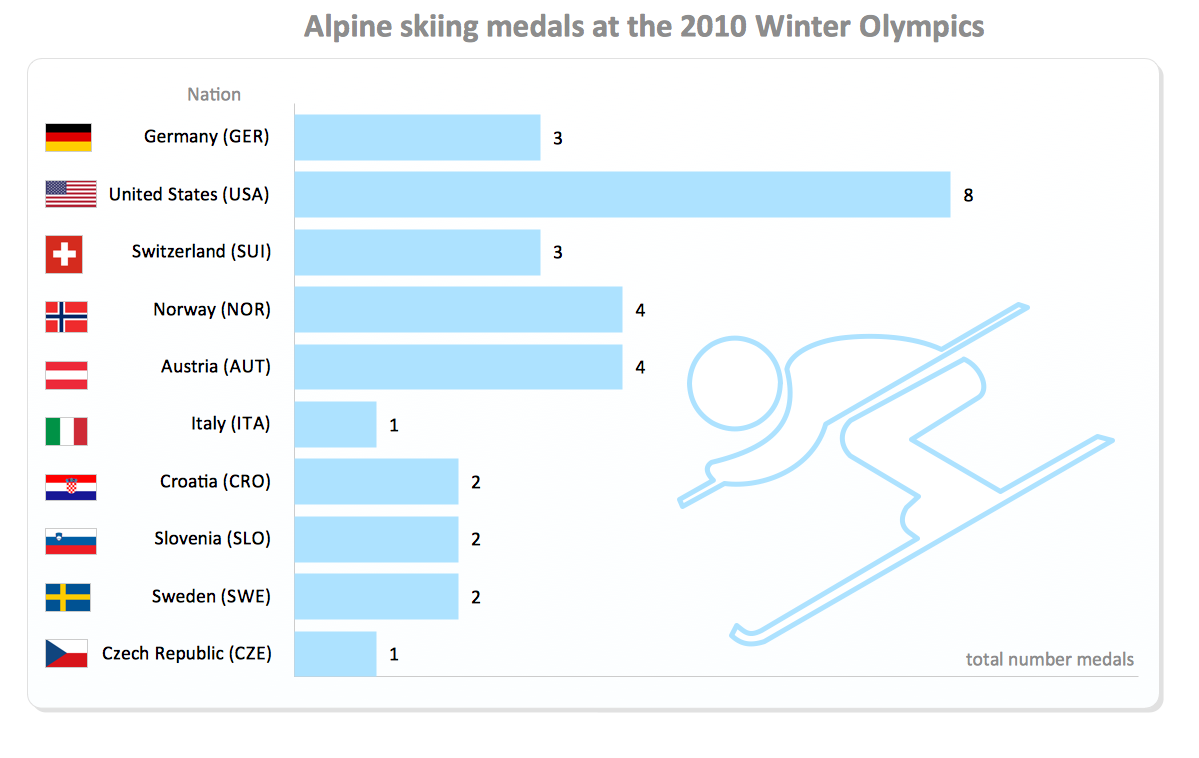
Sample 1. Alpine Skiing Medals at the 2010 Winter Olympics
The Winter Sports solution from Sport Area of ConceptDraw Solution Park contains winter sports illustrations and diagram examples, templates, and vector sport pictogram libraries.
The Winter Sports helps you to quickly visualize any kind of winter sports statistics in format of illustrations, infographics, presentation slides, website, and blog pages using ConceptDraw DIAGRAM diagramming and vector drawing software.
THREE RELATED HOW TO's:
Tracking Olympic results in visual format is the most modern way to deliver statistics to a broad audience. This is a good example of an illustrated table you may easily modify, print, or publish on web from ConceptDraw Winter Sports solution.
Picture: Winter Sports Vector Clipart. Medal Map. Spatial Infographics
Related Solution:
How to draw pictorial chart quick, easy and effective? ConceptDraw DIAGRAM offers the unique Pictorial Infographics Solution that will help you!
Pictorial Infographics solution contains large number of libraries with variety of predesigned vector pictograms that allows you design infographics in minutes. There are available 10 libraries with 197 vector pictograms.
Picture: How to Draw Pictorial Chart. How to Use Infograms
Related Solution:
Infographic is a visual way of representing various information, data, knowledge in statistics, geography, journalism, education, and much more areas. ConceptDraw DIAGRAM supplied with Pictorial Infographics Solution from the “Infographics” Area, provides a set of powerful pictorial infographics tools. Thanks to them it is the best Infographic Maker.
Picture: Infographic Maker
Related Solution: