Unified Modeling Language (UML) is a language of graphic description for object modeling in the field of software engineering. UML was created for definition, visualization, designing of software systems. UML is an open standard that uses graphic notations for creating visual models of object-oriented software systems.
Two types of diagrams are used in UML: Structure Diagrams and Behavior Diagrams. Behavior Diagrams represent the processes proceeding in a modeled environment. Structure Diagrams represent the elements that compose the system.
There are seven types of Structure Diagrams that must be present in any modeled system:
UML Class Diagram is a type of Structure Diagrams that shows the classes of a system, attributes, operations, and the relationships between them.
Package Diagrams
UML Package Diagram is a type of Structure Diagrams that represents the packages of the model and dependencies between them.
Object Diagrams
UML Object Diagram is a type of Structure Diagrams that shows the objects of the system and attributes, and relations between the objects at a certain moment of time.
Use Case Diagrams
UML Use Case Diagram is a type of Behavior Diagrams that displays the dependencies between the actors and use cases.
UML Use Case Diagram displays the system on the conceptual level.
Sequence Diagrams
UML Sequence Diagram is a type of Interaction Diagrams that describes the interactions between objects and classes that are involved in the scenario and the sequence of messages exchanged between them.
Collaboration Diagrams
UML Communication Diagram in UML 2.0 (Collaboration Diagram in UML 1.x) is a type of Interaction Diagrams that displays the interactions of objects using the sequenced messages.
Activity Diagrams
UML Activity Diagram is a type of Behavior Diagrams that graphically describes decomposition of the some activity on the components.
Component Diagrams
UML Component Diagram is a type of Structure Diagrams that shows how components are connected to larger components or software systems, and shows the dependencies among these components.
Deployment Diagrams
UML Deployment Diagram is a type of Structure Diagrams that shows the physical deployment of information generated by the software programs.
State Machine Diagrams
UML State Machine Diagram is a type of Behavior Diagrams that displays the finite state machine with states and state transitions.
Timing Diagrams
UML Timing Diagram in the UML 2.0 is a specific type of Interaction Diagrams that describes the timing constraints.
UML Timing Diagrams describes the behaviors of the objects during a certain period of time.
Interaction Overview Diagrams
UML Interaction Overview Diagram is a type of Interaction Diagrams that describes an overview in which the nodes represent interaction diagrams.
Composite Structure Diagrams
UML Composite Structure Diagram is a type of Structure Diagrams that shows the internal structure of a class and the interactions of elements of the internal structure of the class.
Example 1. UML Class Diagram. AbstractFactory pattern
All libraries for creating UML diagrams are available inside the ConceptDraw DIAGRAM Templates and samples are located in the Rapid UML section of ConceptDraw STORE.
There are many tools to manage a process or to illustrate an algorithm or a workflow. Flowcharting is one of those tools. However, it may be difficult to show complex processes that require multiple attributes or several people in a simple flowchart, so a cross-functional flowchart would be a solution for that situation. To create such flowchart, group processes and steps to labeled rows or columns, and divide those groups with horizontal or vertical parallel lines. It is worth mentioning that there are different types of cross-functional flowcharts, like opportunity or deployment flowchart.
This diagram shows a cross-functional flowchart that was made for a trading process. It contains 14 processes, distributed through 5 lines depicting the participants who interact with the process. Also there are connectors that show the data flow of information between processes. The cross-functional flowchart displays a detailed model of the trading process, as well as all participants in the process and how they interact with each other. The lines in the flowchart indicates the position, department and role of the trading process participants.
Electrical Engineering Solution used together with ConceptDraw DIAGRAM drawing facilities makes short a work of drawing various electrical and electronic circuit schemes. A library of vector objects composed from symbols of Analog and Digital Logic elements of electric circuit includes 40 symbolic images of logic gates, bistable switches of bi-stable electric current, circuit controllers, amplifiers, regulators, generators, etc. All of them can be applied in electronic circuit schemes for showing both analog and digital elements of the circuit.
Electrical Engineering Solution used together with ConceptDraw DIAGRAM drawing facilities makes short a work of drawing various electrical and electronic circuit schemes. A library of vector objects composed from symbols of Analog and Digital Logic elements of electric circuit includes 40 symbolic images of logic gates, bistable switches of bi-stable electric current, circuit controllers, amplifiers, regulators, generators, etc. All of them can be applied in electronic circuit schemes for showing both analog and digital elements of the circuit.
ConceptDraw DIAGRAM is workflow diagram software enhanced by numerous extentions from ConceptDraw Solution Park. It inludes many professional workflow diagrams, examples and ready to use workflow diagram and workflow symbols. Workflow symbol collections include symbols for Processes, Planning, Scheduling, Flow Control, In-Transit Process Visibility.
The best workflow diagram software you may find is ConceptDraw DIAGRAM. ConceptDraw DIAGRAM is world-known diagramming software that works for both Windows and Mac OS X platforms. The software contains complete set of features allows to draw diagrams faster. ConceptDraw DIAGRAM extended with the Workflow Diagram solution provides additional libraries, templates and samples for drawing professional workflow diagrams.
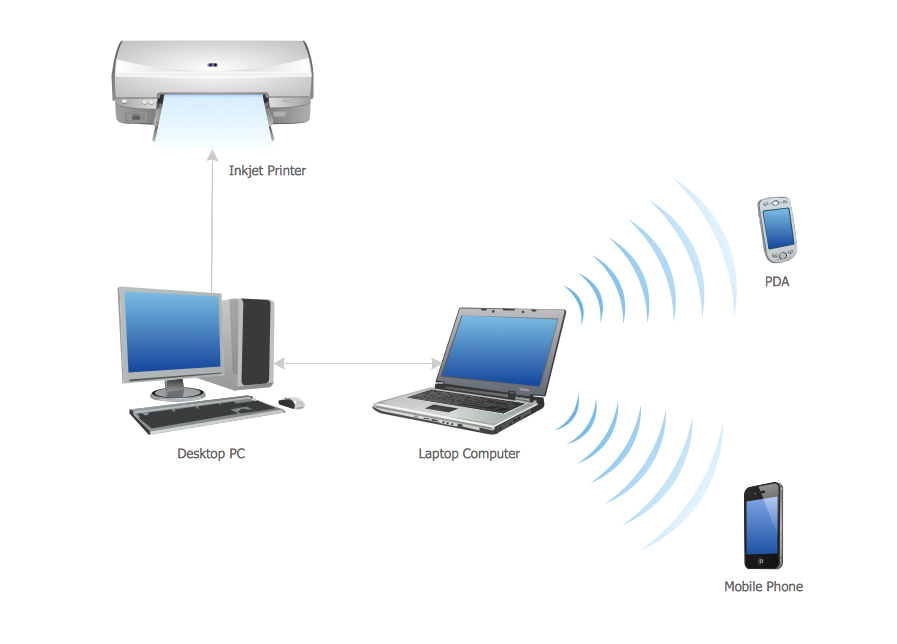
All computer networks differ by various params, and their size is one of them. As global area networks are the biggest, personal area (PAN) networks are the smallest. Personal computers, smartphones and other devices that have possibility to connect to Internet form a personal network.
This diagram was created using ConceptDraw Computer Network Diagrams to represent a typical components of Personal area network. A personal area network (PAN) is the connection of IT devices around an individual person. This sample of personal area network involves a notebook, a personal digital assistant (PDA), and a portable printer. Commonly a PAN contains such wireless devices as mouse, keyboard, smartphone and tablet. A wireless connection is typical for a PAN.
Picture: Personal area (PAN) networks. Computer and Network Examples
A waterfall model describes software development process as a sequence of phases that flow downwards. SSADM is one of the implementations of waterfall method. It’s easier to learn about structured systems analysis and design method (SSADM) with ConceptDraw DIAGRAM because this software has appropriate tools for creating data flow diagrams. You can use all the three main techniques of SSADM method with special tools and predesigned templates.
This data flow diagram illustrates the Structured Systems Analysis and Design Method. This method method considers analysis, projecting and documenting of information systems. Data flow models are the most important elements of SSADM and data flow diagrams are usually used for their description. It includes the analysis and description of a system as well as visualization of possible issues.
Picture: Structured Systems Analysis and Design Method. SSADM with ConceptDraw DIAGRAM
Fishbone, Ishikawa or Cause and Effect diagram helps understand the reasons of completed or potential actions by structuring their causes in smaller categories. Also, one can use it to see how the contributing factors are related to each other. In everyday company routine, a Cause and Effect diagram is helpful with a number of regular activities like brainstorming, project management, and problem solving.
How to Construct a Fishbone Diagram? Construction a Fishbone diagram in professional diagramming software ConceptDraw DIAGRAM is more easy than you think. Just use the predesigned vector elements from the Fishbone Diagrams library for Fishbone Diagrams solution or one of plenty Fishbone templates and examples, and you will get a Cause and Effect diagram in minutes.
The vector stencils library UML Use Case contains specific symbols of the UML notation such as actors, actions, associations and relationships for the ConceptDraw DIAGRAM diagramming and vector drawing software. This library is contained in the Rapid UML solution from Software Development area of ConceptDraw Solution Park.