Spatial Infographics
Infographics
ConceptDraw DIAGRAM is a powerful software for infographic construction. Map infographics are a natural way to represent geographical data. The Spatial Infographics solution allows for more dimensions to be represented using various route objects, maps, and landmarks. The addition to this new solution permits users to quickly and easily draw professional infographics that quickly orient viewers so they can be self-directed to a point of interest.

Sample 1. Northern line extension to Battersea via Nine Elms - Spatial infographics.
Solution Spatial Infographics from ConceptDraw Solution Park extends ConceptDraw DIAGRAM ector diagramming and business graphics software with easy-to-use spatial infographics drawing tools.
This solution contains spatial infographics samples, map templates to be filled in, and libraries of vector stencils for main design elements of spatial infographics.
Use this solution to draw your own geospatial infographics documents with thematic maps, road maps, directional maps and transport maps.
FIVE RELATED HOW TO's:
How to draw Metro Map style infographics of New York subway.
New York Subway has a long history starting on October 27, 1904. Since the opening many agencies have provided schemes of the subway system. At present time are 34 lines in use. This page present New York City subway map construct with Metro Map Solution in Conceptdraw DIAGRAM software. This is a one-click tool to add stations to the map. It lets you control the direction in which you create new stations, change lengths, and add text labels and icons. It contains Lines, Stations, and Landmarks objects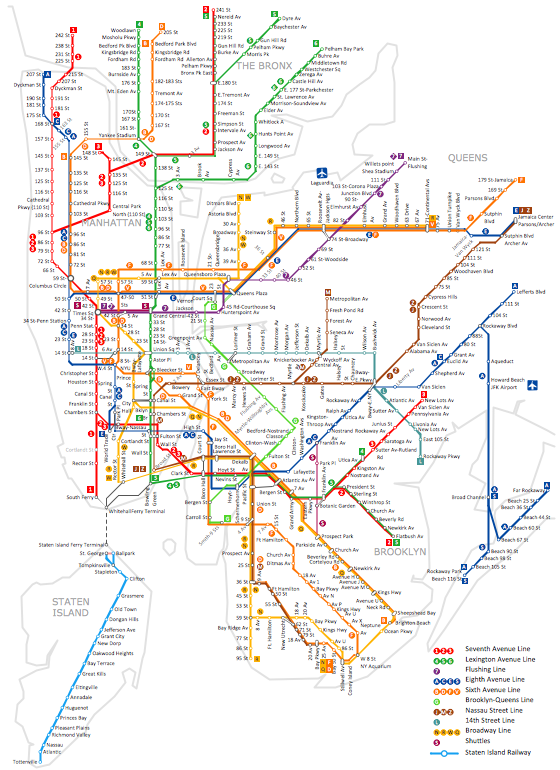
Picture: How to draw Metro Map style infographics? (New York)
Related Solution:
ConceptDraw DIAGRAM diagramming and vector drawing software extended with Pictorial Infographics Solution from the “Infographics” Area is the best for Spatial Data Analysis. You have a perfect possibility to make sure this right now.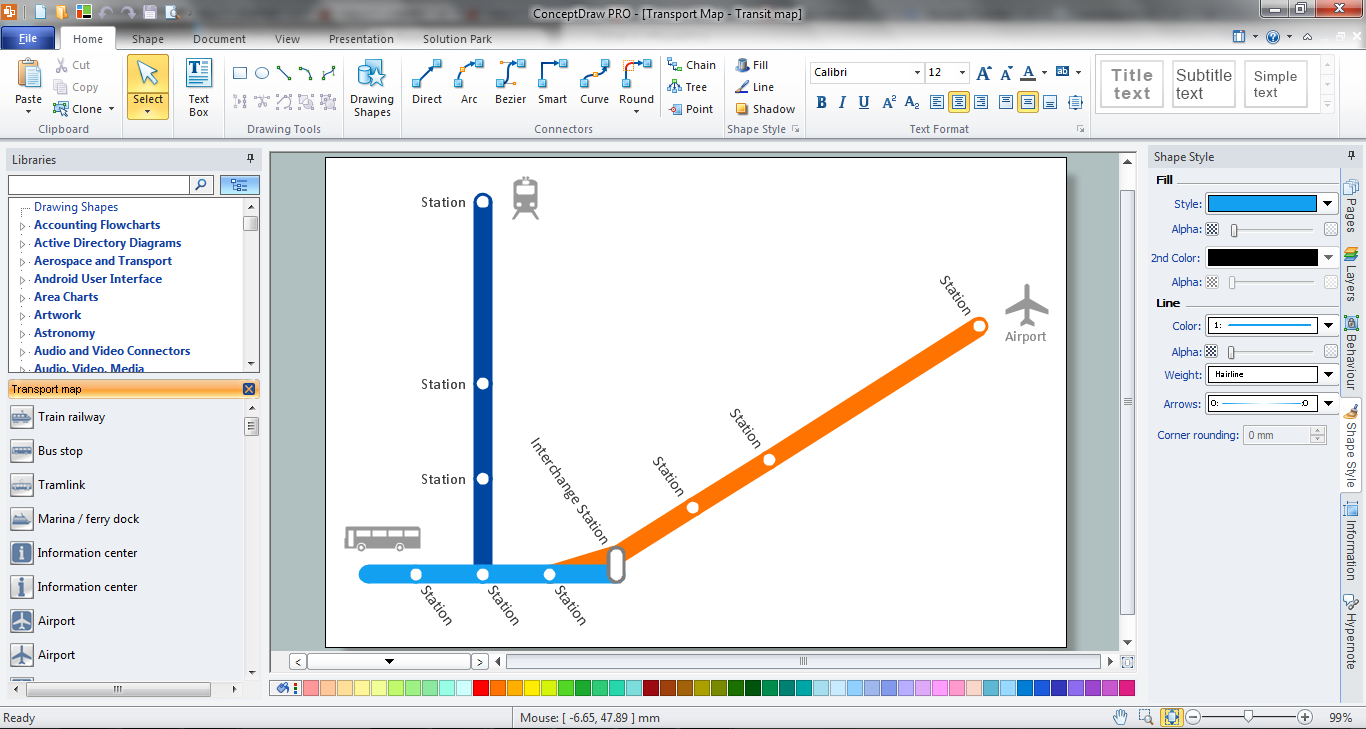
Picture: Spatial Data Analysis
Related Solution:
You want design Pictorial Chart or Infographic? And you need powerful infographic software? Then ConceptDraw DIAGRAM diagramming and vector drawing software extended with Pictorial Infographics Solution from the “Infographics” Area is exactly what you need.
Picture: Pictorial Chart
Related Solution:
A basic vacation preparation mind map.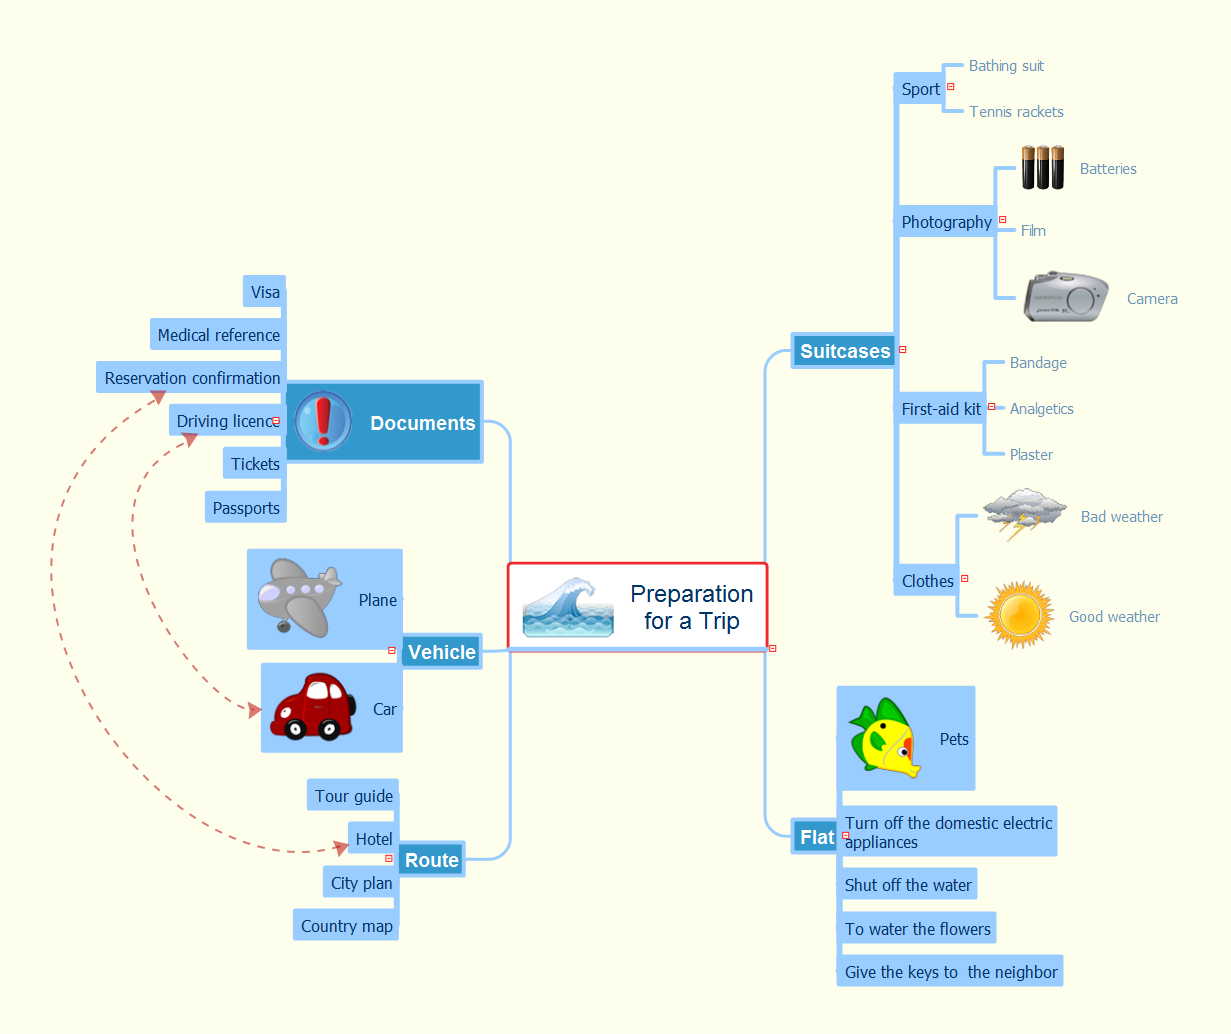
Picture: Preparation for a Trip
Related Solution: