Soccer (Football) Formation
The soccer (football) formation is an arrangement of the players on the pitch and their behavior during the game to meet the objectives set by the soccer coach. The different formations are used depending on the team goals. Thanks to a certain starting position of the player it is possible to define its main tasks in the match. The numbers in the designation of the formation mean respectively: the number of defenders, midfielders and forwards.
Using diagrams is the easiest way to explain the soccer formations. The Soccer solution from the Sport area of ConceptDraw Solution Park is designed as a tool that helps you produce the soccer diagrams in a few minutes. The predesigned samples of the Soccer solution for ConceptDraw DIAGRAM depict the most popular formation diagrams.
Use the "Soccer (Football) Fields" and "Soccer (Football) Positions" libraries from the Soccer solution and follow the next steps to create your own soccer-related drawing quick and easy:
- From the "Soccer (Football) Fields" library drop a field object to your document;
- From the "Soccer (Football) Positions" library drop all position objects you need to your document;
- Place positions on the field according to your drawing idea;
- Add arrows or text labels if needed.
Sample 1. Soccer (Football) Formation 2—3—5 Pyramid
This sample shows the 2–3–5 formation that is also known as the "Pyramid". By the 1890s, it was the standard formation in England and then it was spread all over the world. In this formation was reached the balance between the attack and defense.
 Formation")
Sample 2. Soccer (Football) Formation 3—2—5 WM
On this sample you can see the soccer formation 3–2–5 WM. The WM system was created in 1920s by Herbert Chapman of Arsenal. Was reduced the number of opposition players and was introduced a centre-back to stop the opposing centre-forward. The WM system was subsequently adapted by several English sides.
 Formation")
Sample 3. Soccer (Football) Formation 3—4—3
This sample shows the formation 3–4–3 that is used by the offensive teams, for example by Liverpool under Rafael Benitez during the second half of the 2005 UEFA Champions League Final. There are only three defenders. So if the opposing team will break through the midfield, they will have a great chance to score.
 Formation")
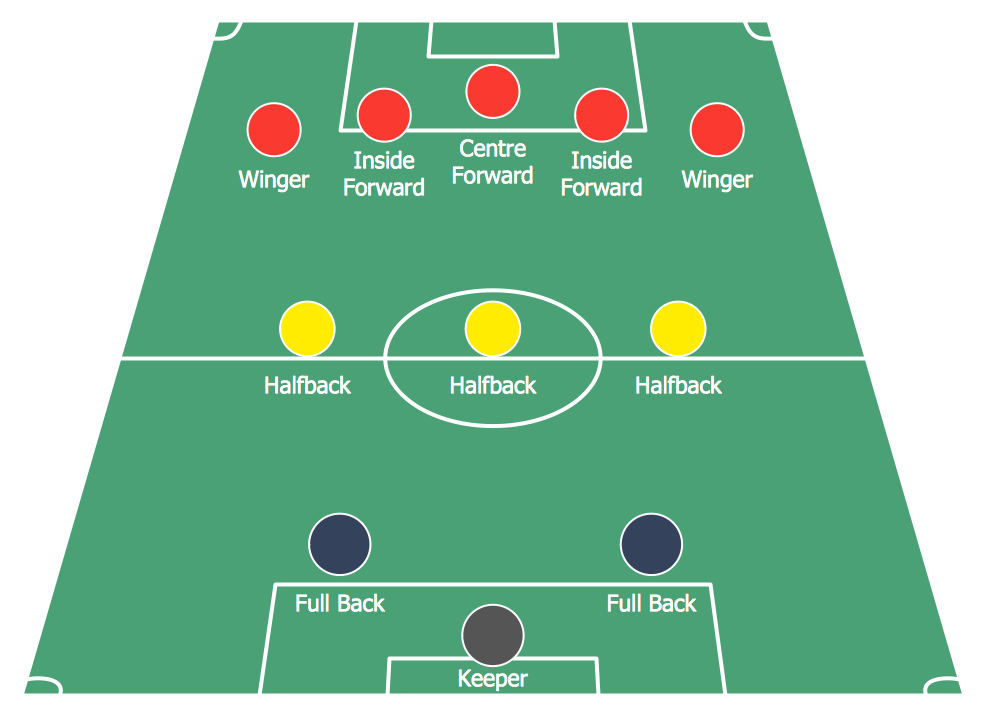
Sample 4. Soccer (Football) Formation 4—3—3
The soccer formation 4–3–3 that you see on this sample was developed from the 4–2–4. The Brazilian national team in the 1962 World Cup was played 4–3–3. The three midfielders move laterally across the field as a coordinated unit and play together to protect the defense. The three forwards split across the field to spread the attack. The 4-3-3 formation is very useful for ball retention and for a short passing game.
 Formation")
Sample 5. Soccer (Football) Formation 4—4—1—1
This sample demonstrates the formation 4-4-1-1. One of the strikers plays as a "second striker" ("in the hole"). The second striker is a playmaker that can easy drop into midfield to pick up the ball before running it.
 Formation")
Sample 6. Soccer (Football) Formation 4—4—2
On this sample you can see the soccer formation 4–4–2 that was successfully used by Fabio Capello that won three European Cups, two Intercontinental Cups, and three UEFA Super Cups between 1988 and 1995. And also Carlo Ancelotti's Milan used it on the UEFA Champions League where he won the final in 2003 and made runners-up in 2005. The formation 4–4–2 has only two forwards and is defensive formation. The team forms the game on the counter-attacks.
The samples you see on this page were created in ConceptDraw DIAGRAM using the Soccer Solution. They demonstrate the solution's capabilities and the professional results you can achieve. An experienced user spent no more than 5 minutes creating every of these samples.
All source documents are vector graphic documents. They are available for reviewing, modifying, or converting to a variety of formats (PDF file, MS PowerPoint, MS Visio, and many other graphic formats) from the ConceptDraw STORE. The Soccer Solution is available for all ConceptDraw DIAGRAM or later users.
TEN RELATED HOW TO's:
These libraries of vector objects depict the Site Accessories and Parking and Roads elements. They are needed to draw architectural and landscape plans that show the architectural elements around buildings: parking spaces, hiking and biking trails, drainage systems, lights, and vehicle access control elements. These libraries are included into ConcepDraw solution for Site Planning. Site Accessories and Parking, Roads libraries contain near 40 vector images that will help depict an a surrounding territory at building plans.
These libraries of vector objects depict the Site Accessories and Parking and Roads elements. They are needed to draw architectural and landscape plans that show the architectural elements around buildings: parking spaces, hiking and biking trails, drainage systems, lights, and vehicle access control elements. These libraries are included into ConcepDraw solution for Site Planning. Site Accessories and Parking, Roads libraries contain near 40 vector images that will help depict an a surrounding territory at building plans.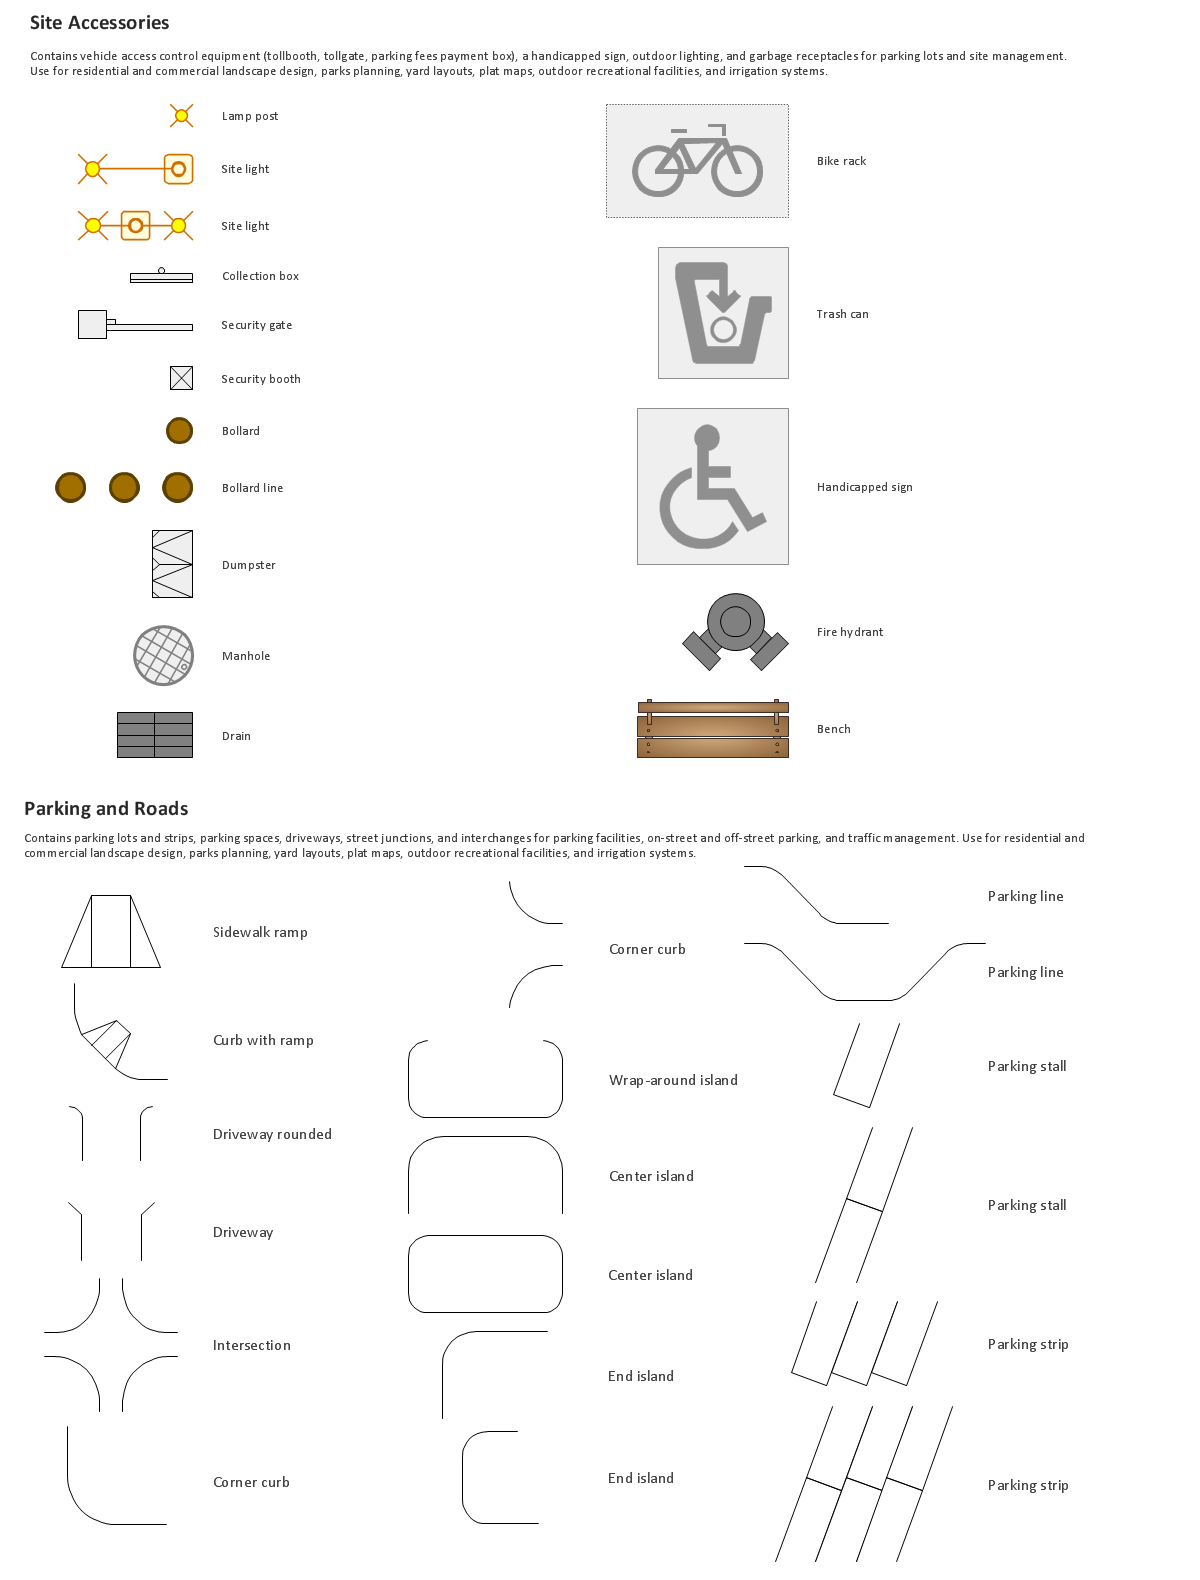
Picture: Building Drawing. Design Element Site Plan
Related Solution:
Extending ConceptDraw DIAGRAM software with the Football solution from the ConceptDraw Solution Park you receive a complete set of libraries, templates and samples allowing to draw defensive plays diagrams in seconds. You can start from a template, change positions and get ready diagram in some clicks.
Picture: Defensive Play Diagram – Under Front
Related Solution:
ConceptDraw DIAGRAM software extended with Sport Field Plans Solution from the Building Plans Area is a perfect software for drawing professional looking playground layout of any complexity.
Picture: Playground Layout
Related Solution:
ConceptDraw Ice Hockey solution is a good tool to think about complex things. You don't need a software during hockey match, of course. Drawing software helps to plan strategy and tactics before a match, and then analyze mistakes and results.
Picture: Ice Hockey Diagram – Penalty Kill Forecheck Angling Drill
Related Solution:
It is impossible to imagine mechanical engineering without drawings which represent various mechanical schemes and designs. ConceptDraw DIAGRAM diagramming and vector drawing software supplied with Mechanical Engineering solution from the Engineering area of ConceptDraw Solution Park offers the set of useful tools which make it a powerful Mechanical Drawing Software.
Picture: Mechanical Drawing Software
Related Solution:
Infield Positioning for Baseball Situations - Baseball is very interesting and popular sport game. As each sport game it includes large quantity of game situations, positions and rules. If you are baseball coach or fan, you need convenient and useful software to design the baseball-related diagrams. In this case ConceptDraw DIAGRAM diagramming and vector drawing software is a real godsend for you!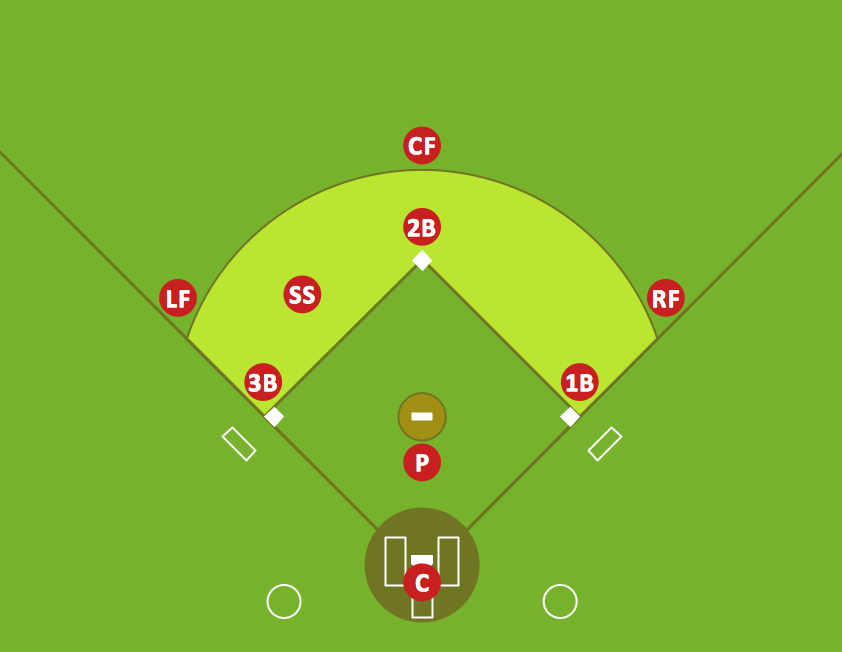
Picture: Infield Positioning for Baseball Situations
Related Solution:
While creating flowcharts and process flow diagrams, you should use special objects to define different statements, so anyone aware of flowcharts can get your scheme right. There is a short and an extended list of basic flowchart symbols and their meaning. Basic flowchart symbols include terminator objects, rectangles for describing steps of a process, diamonds representing appearing conditions and questions and parallelograms to show incoming data.
This diagram gives a general review of the standard symbols that are used when creating flowcharts and process flow diagrams. The practice of using a set of standard flowchart symbols was admitted in order to make flowcharts and other process flow diagrams created by any person properly understandable by other people. The flowchart symbols depict different kinds of actions and phases in a process. The sequence of the actions, and the relationships between them are shown by special lines and arrows. There are a large number of flowchart symbols. Which of them can be used in the particular diagram depends on its type. For instance, some symbols used in data flow diagrams usually are not used in the process flowcharts. Business process system use exactly these flowchart symbols.
Picture: Basic Flowchart Symbols and Meaning
Related Solution:
Local area network connects computers and other network appliances within an area, such as office building or a campus. It can be difficult to provide such network without a predesigned plan. For these purposes you can use network diagram software, which helps you to create LAN network diagrams and office network diagrams quickly and effortless. This will speed up your work and you can save the diagram for the future network improvements.
The following diagram illustrates a network topology of the small office. LAN configuration has a star topology. The local network joins 8 computers among which are several desktop PCs, laptop, two iMacs and iBook. The end-point devices are divided into three groups. Each group is connected to its hub. There is a network printer and a modem, which are interconnected with other devices through a network server. Each computer on the LAN can access the server through a corresponding hub.
Picture: Network Diagram Software. LAN Network Diagrams. Physical Office Network Diagrams
Related Solution:
ConceptDraw DIAGRAM software extended with the Baseball solution delivers samples with diagrams of the most popular plays in baseball. You can complete this set modifying any sample. All you need is to drag and drop objects to depict another play and then save with the different name. Feel free to add text label with the play name directly to your document.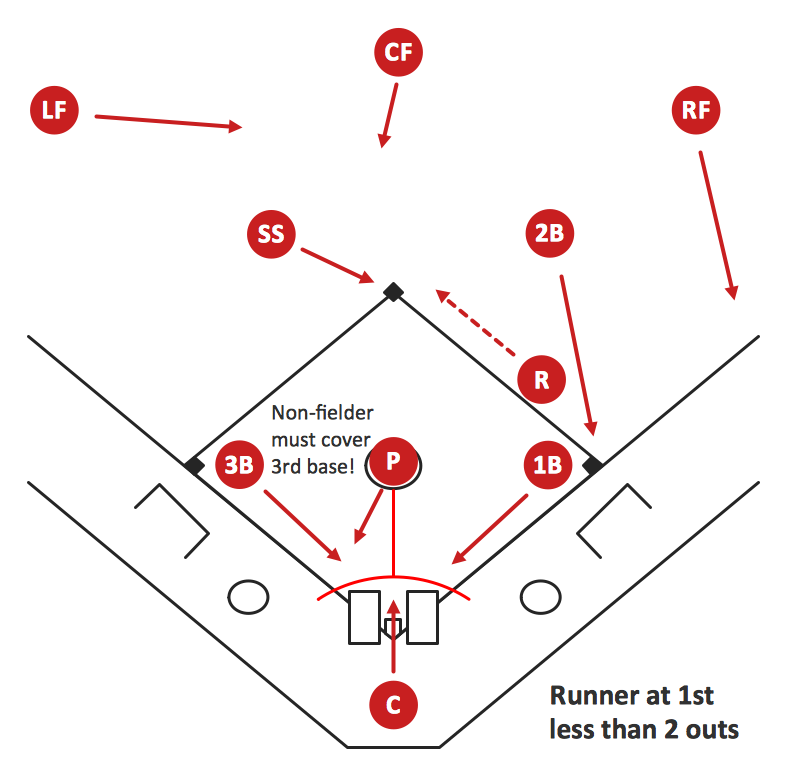
Picture: Baseball Diagram – Basic Bunt Coverage – Runner at 1st
Related Solution:
The intuitive interface of ConceptDraw MINDMAP and the Functional Tools overview below will guide you in creating and demonstrating powerful mind map presentations using template.
An advanced tool allows you effectively generate, change, and update your presentation.
Picture: Create a Presentation Using a Design Template
Related Solution:
 Formation")
 Formation")
 Formation")
 Formation")
 Formation")