Samples of Flowcharting
This sample was created in ConceptDraw DIAGRAM diagramming and vector drawing software using the Flowcharts solution from the "Diagrams" area of ConceptDraw Solution Park.
This sample shows the Flowchart for determine is a species heterotroph or autotroph, or a subtype. This diagram has start point and end points. The diamonds on the Flowchart represent the decisions. The Flowcharts are widely used in science, analytics, government, politics, business, engineering, architecture, marketing, manufacturing, administration, etc.
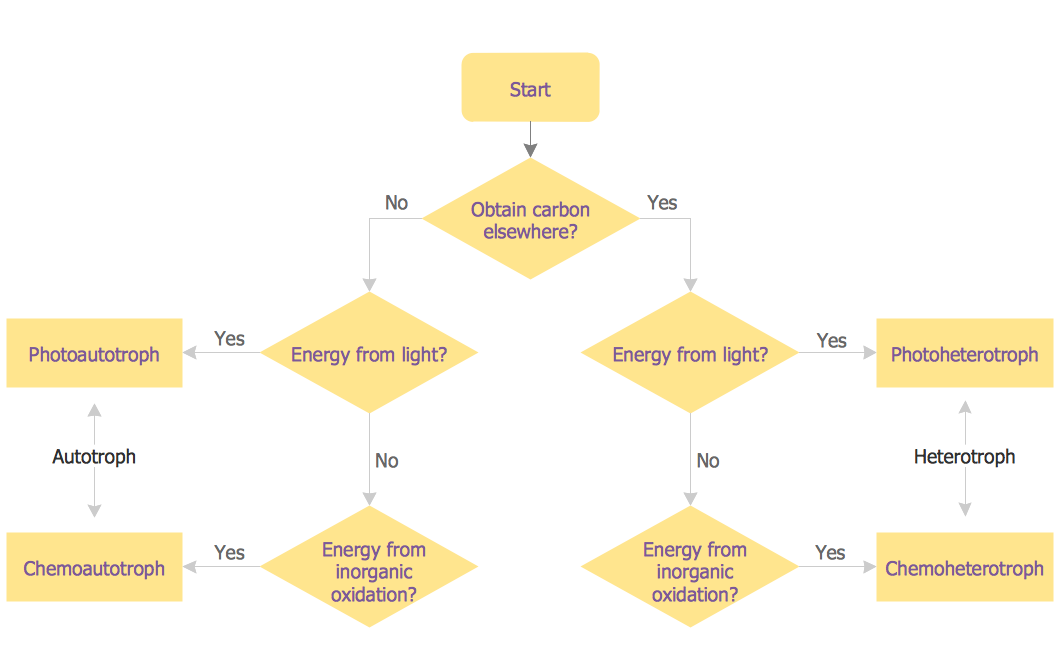
Example 1. Troph flowchart
This example was redesigned from the Wikimedia Commons file [commons.wikimedia.org]
Using the ready-to-use predesigned objects, samples and templates from the Flowcharts Solution for ConceptDraw DIAGRAM you can create your own professional looking Flowchart Diagrams quick and easy.
The Flowcharts produced with ConceptDraw DIAGRAM are vector graphic documents and are available for reviewing, modifying, and converting to a variety of formats (image, HTML, PDF file, MS PowerPoint Presentation, Adobe Flash or MS Visio).
See also Samples:
SIX RELATED HOW TO's:
What illustrates a technical flow chart? Technical flow chart is a diagrammatic representation which visually illustrates the sequence of operations that must to be performed to get the problem's solution.
ConceptDraw DIAGRAM enhanced with Flowcharts Solution from the "Diagrams" Area of ConceptDraw Solution is a perfect software for drawing Technical Flow Chart Example illustrating the essence and importance of the technical flow chart use.
Picture: Technical Flow Chart Example
Related Solution:
This sample was created in ConceptDraw DIAGRAM diagramming and vector drawing software using the Flowcharts solution from the Diagrams area of ConceptDraw Solution Park.
This sample shows the Flowchart of the Credit Card Order Process. On this diagram are used the flowchart symbols that represents the processes and documents. The flowchart symbols are connected with arrows.
Picture: Credit Card Order Process Flowchart. Flowchart Examples
Related Solution:
This sample shows the Flowchart that displays the layout and work flow of the cloud marketing platform. This diagram has a style of the marketing brochure. This style displays the central product that is related to the other issues.
Using the ready-to-use predesigned objects, samples and templates from the Flowcharts Solution for ConceptDraw DIAGRAM you can create your own professional looking Flowchart Diagrams quick and easy.
Picture: Flowchart Marketing Process. Flowchart Examples
Related Solution:
A flowchart is a powerful tool for examining processes. It helps improving processes a lot, as it becomes much easier to communicate between involved people, to identify potential problems and to optimize workflow. There are flowcharts of different shapes, sizes and types of flowchart vary from quite basic process flowcharts to complex program flowcharts. Nevertheless, all these diagrams use the same set of special symbols like arrows to connect blocks, parallelogram to show data receiving or rectangles for showing process steps.
Basic flowcharts are used to represent a simple process algorithm. A basic flowchart notation consists of rectangles (business processes), arrows (the flow of information, documents, etc.). The same notation is used in items such as the "decision", which allow you to do the branching. To indicate the start of the entire business process and its termination can be used the "Terminator" element. The advantages of Basic Flowchart are simplicity and clarity. With it you can quickly describe the business process steps. Creating of Basic Flowchart does not require any special knowledge, as easily understand by employees with different levels of education and IQ.
Picture: Types of Flowchart - Overview
Related Solution:
Accounting is a cornerstone of any business, it’s basement. If you want to have a visual representation of your finance management, use audit flowchart symbols to document the money flow. Although some would say that accounting is boring, it is very a responsible duty.
The audit flowchart symbols is supplied with ConceptDraw Audit Flowcharts solution as a vector objects library. Together with Conceptdraw Drawing capabilities it forms the helpful tool for audit process planning and setting the steps of audit by designing audit flow charts. Audit Flow charts are used to organize fiscal information tracking process as well as in accounting, finance and investment management.
Picture: Audit Flowchart Symbols
Related Solution:
The Flowcharts have one or more starting and ending points. The geometric figures on the Flowcharts represent the steps of the process and are connected with arrows that show the sequence of the actions. The Flowcharts can be orientated vertically or horizontally.
ConceptDraw DIAGRAM is a powerful software for creating professional looking Flowcharts quick and easy. For this purpose you can use the Flowcharts solution from the Diagrams area of ConceptDraw Solution Park.
Picture: Flowchart. What is Flowchart
Related Solution: