Quality Engineering Diagrams
ConceptDraw DIAGRAM is a bundle of the vector stencils, examples, and templates for drawing quality diagrams. Value Stream Mapping solution is a Lean Manufacturing tool that uses a flow diagram to document in great detail every step of a manufacturing process. This graphical representation of a process is a powerful tool that helps in the diagnosis of process efficiency and allows company to develop improved processes.
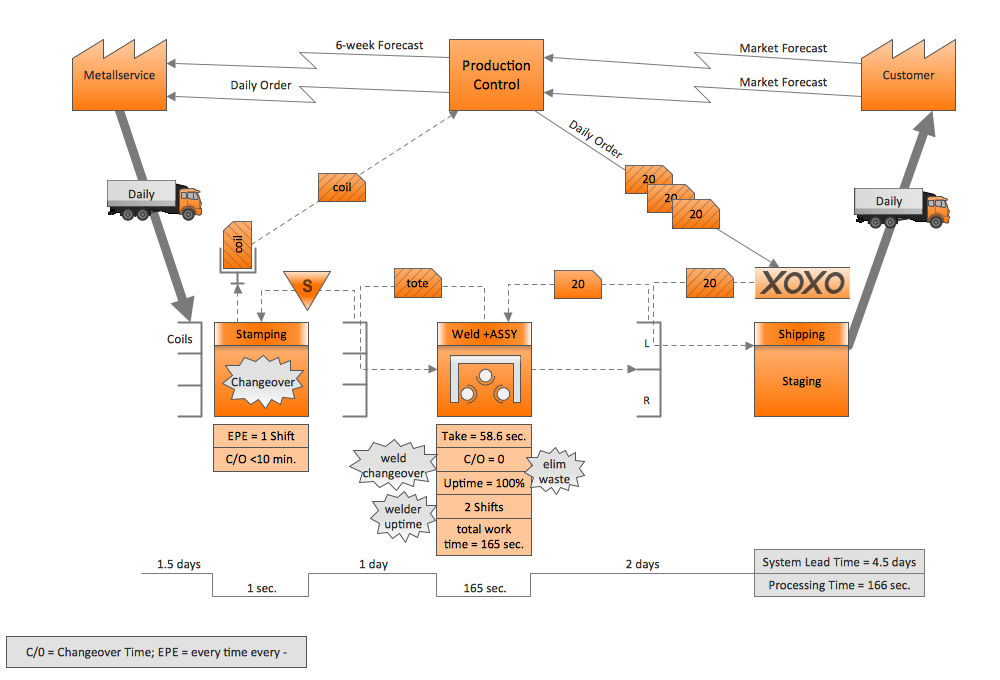
Pic.1 Value stream mapping (VSM) sample.
This example of a Value Stream Map diagram was drawn using ConceptDraw DIAGRAM with the Value Stream Mapping solution from ConceptDraw Solution Park.
This sample VSM flowchart shows the value stream in a manufacturing, production control and shipping processes.
See also Samples:
TEN RELATED HOW TO's:
Value stream maps (VSM) are an essential tool for organizations applying Lean methods.
Picture: What is Value Stream Mapping?
Related Solution:
There are many tools to manage a process or to illustrate an algorithm or a workflow. Flowcharting is one of those tools. However, it may be difficult to show complex processes that require multiple attributes or several people in a simple flowchart, so a cross-functional flowchart would be a solution for that situation. To create such flowchart, group processes and steps to labeled rows or columns, and divide those groups with horizontal or vertical parallel lines. It is worth mentioning that there are different types of cross-functional flowcharts, like opportunity or deployment flowchart.
This diagram shows a cross-functional flowchart that was made for a trading process. It contains 14 processes, distributed through 5 lines depicting the participants who interact with the process. Also there are connectors that show the data flow of information between processes. The cross-functional flowchart displays a detailed model of the trading process, as well as all participants in the process and how they interact with each other. The lines in the flowchart indicates the position, department and role of the trading process participants.
Picture: Cross-Functional Flowchart
Related Solution:
Lean Six Sigma (LSS) is a well-known in all over the world methodology of quality improvement and business perfection. ConceptDraw DIAGRAM diagramming and vector drawing software is a powerful Lean Six Sigma Diagram Software thanks to the included Value Stream Mapping solution from the Quality Management Area of ConceptDraw Solution Park.
Picture: Lean Six Sigma Diagram Software
Related Solution:
Value Stream Mapping solution extends ConceptDraw DIAGRAM software with templates, samples and vector shapes for drawing the current state value stream maps.
Picture: Learn how to create a current state value stream map
Related Solution:
EPC or The Event - driven Process Chain diagrams that provide Enterprise Resource Planning improvement.
ConceptDraw DIAGRAM - software that reduces the time needed to create a business process model.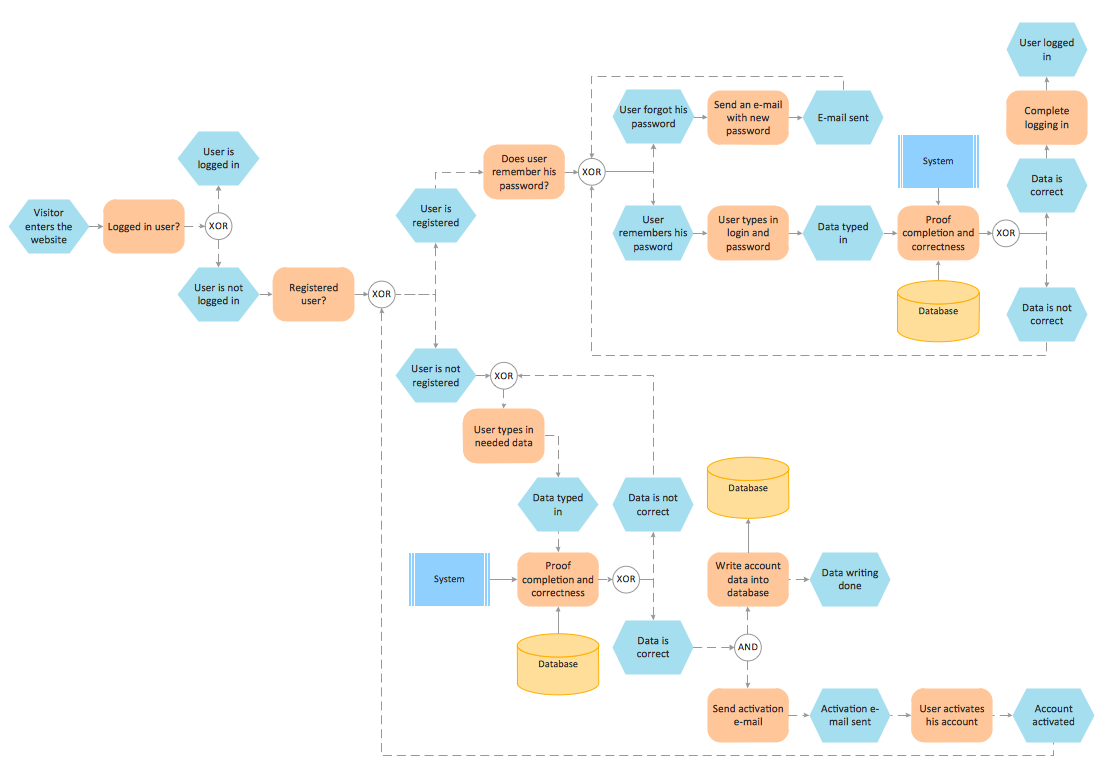
Picture: Formalization and Verification of Event-driven Process chain
Related Solution:
This sample was created in ConceptDraw DIAGRAM diagramming and vector drawing software using the Workflow Diagrams Solution from the Software Development area of ConceptDraw Solution Park.
This sample shows the Workflow Diagram that clearly illustrates stages a BPM consists of and relations between all parts of business. The Workflow Diagrams are used to represent the transferring of data during the work process, to study and analysis the working processes, and to optimize a workflow.

Picture: Software Work Flow Process in Project Management with Diagram
Related Solution:
Create value stream maps - for value stream analysis and value stream management, material and information flow mapping, using our quick start templates included with ConceptDraw.
Picture: Best Value Stream Mapping mac Software
Related Solution:
ConceptDraw DIAGRAM diagramming and vector drawing software extended with Chemical and Process Engineering Solution from the Industrial Engineering Area of ConceptDraw Solution Park offers you the set of useful tools for easy drawing various Process Diagrams.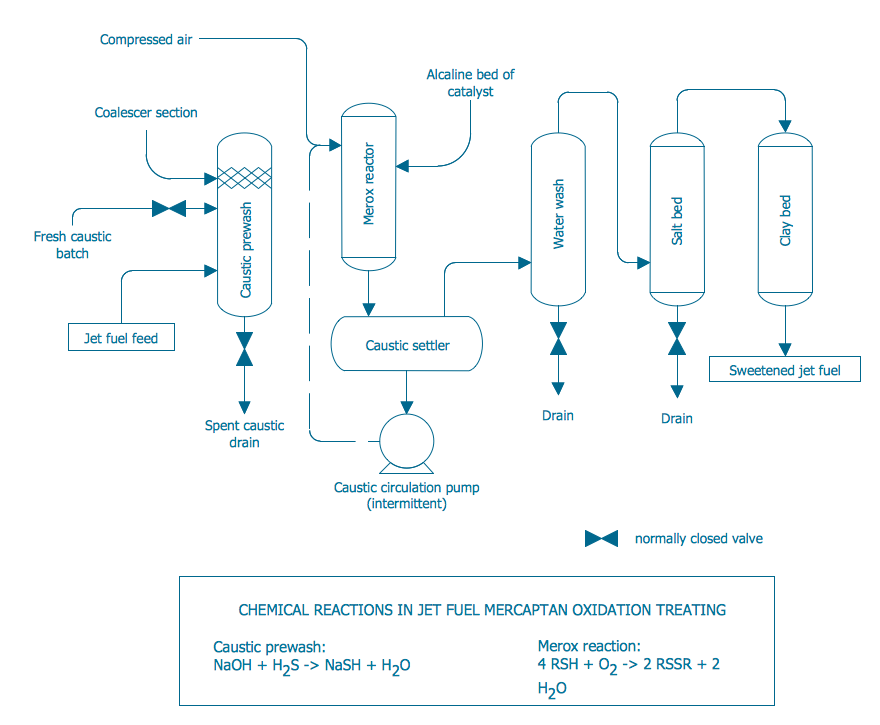
Picture: Process Diagrams
Related Solution:
Value Stream & Process Flow Diagramming Software is a very popular Lean Manufacturing tool that allows to see and visualize in details the company's processes and current state, the flow of material and information, and thus gives the possibility to analyze the efficiency of company's processes and then develop improved processes. Value stream maps are also a good way to define the steps that do not add value to the end product, in other words waste in a company's processes.
Picture: Value Stream & Process Flow Diagramming Software
Related Solution:
Workflow Diagram created by using special software based on graphic mastering technology Arrows10. Its automatics follows the global concept of business graphics and diagramming. The practical effectiveness of Arrows10 technology used in ConceptDraw DIAGRAM are around the quick auto-arrows behaving as expected and connecting boxes of workflow diagram from workflow symbol to process flow symbol.
ConceptDraw DIAGRAM is a workflow diagram software contains specific features help you to draw diagrams faster, such as RapidDraw, or Arrows10. There is also a rich set of samples and templates to give you an example of data may be visualized as workflow diagram.
Picture: Workflow Diagram Data
Related Solution: