Piping and Instrumentation Diagram Software
Piping and Instrumentation Diagram (P&ID)
Piping and Instrumentation Diagram (P&ID) is a technical drawing that shows the details of piping and instrumentation of a processing plant.
P&IDs are developed at the design stage of a plant by process design engineers. Then they are used at the construction and operating the plant by construction teams, operators, instrumentation and piping engineers.
")
Pic. 1. Piping and Instrumentation Diagrams (P&ID)
Piping and Instrumentation Diagram Software
ConceptDraw piping and instrumentation diagram software works across any platform, meaning you never have to worry about compatibility again. ConceptDraw DIAGRAM allows you to make piping and instrumentation diagram on PC or macOS operating systems.
ConceptDraw DIAGRAM provides Plumbing and Piping Plans solution from the Building Plans area of ConceptDraw Solution Park.
Plumbing and Piping Plans solution helps you create quick and easy:
- key piping and instrument details
- piping diagrams
- instrumentation diagrams
- schemes of hot and cold water supply systems
- control and shutdown schemes
- diagrams of plumbing systems
- heating schemes
- schematics of waste water disposal systems
- safety and regulatory requirements
- diagrams of ventilation systems
- mechanical diagrams
- industrial diagrams
- basic start up and operational information
Pic. 2. Piping and Instrumentation Diagram Software
Piping and Valves Symbols
Plumbing and Piping Plans solution from the Building Plans area of ConceptDraw Solution Park provides the following 4 vector stencils libraries:
Use the design elements libraries "Pipes 1" and "Pipes 2" for drawing plumbing and piping building plans, schematic diagrams, blueprints, or technical drawings of waste water disposal systems, hot and cold water supply systems.
- Pipes 1 library contains 28 symbols

- Pipes 2 library contains 42 symbols

- Valves library contains 37 symbols
Use the design elements library "Valves" to draw building plans, schematic diagrams, blueprints, or technical drawings of industrial piping systems; process, vacuum, and fluids piping; hydraulics piping; air and gas piping; materials distribution; and liquid transfer system.

- Plumbing library contains 31 symbols.
Use the design elements library "Plumbing" for drawing plumbing and piping plans, schematic diagrams and blueprints of waste water disposal systems, and hot and cold water supply systems.

These libraries contain 138 shapes of pipes, valves, pumps, boilers, tanks, and other sanitary equipment. You can simply drag-and-drop them from the libraries into your document and use for designing your piping and instrumentation diagrams.
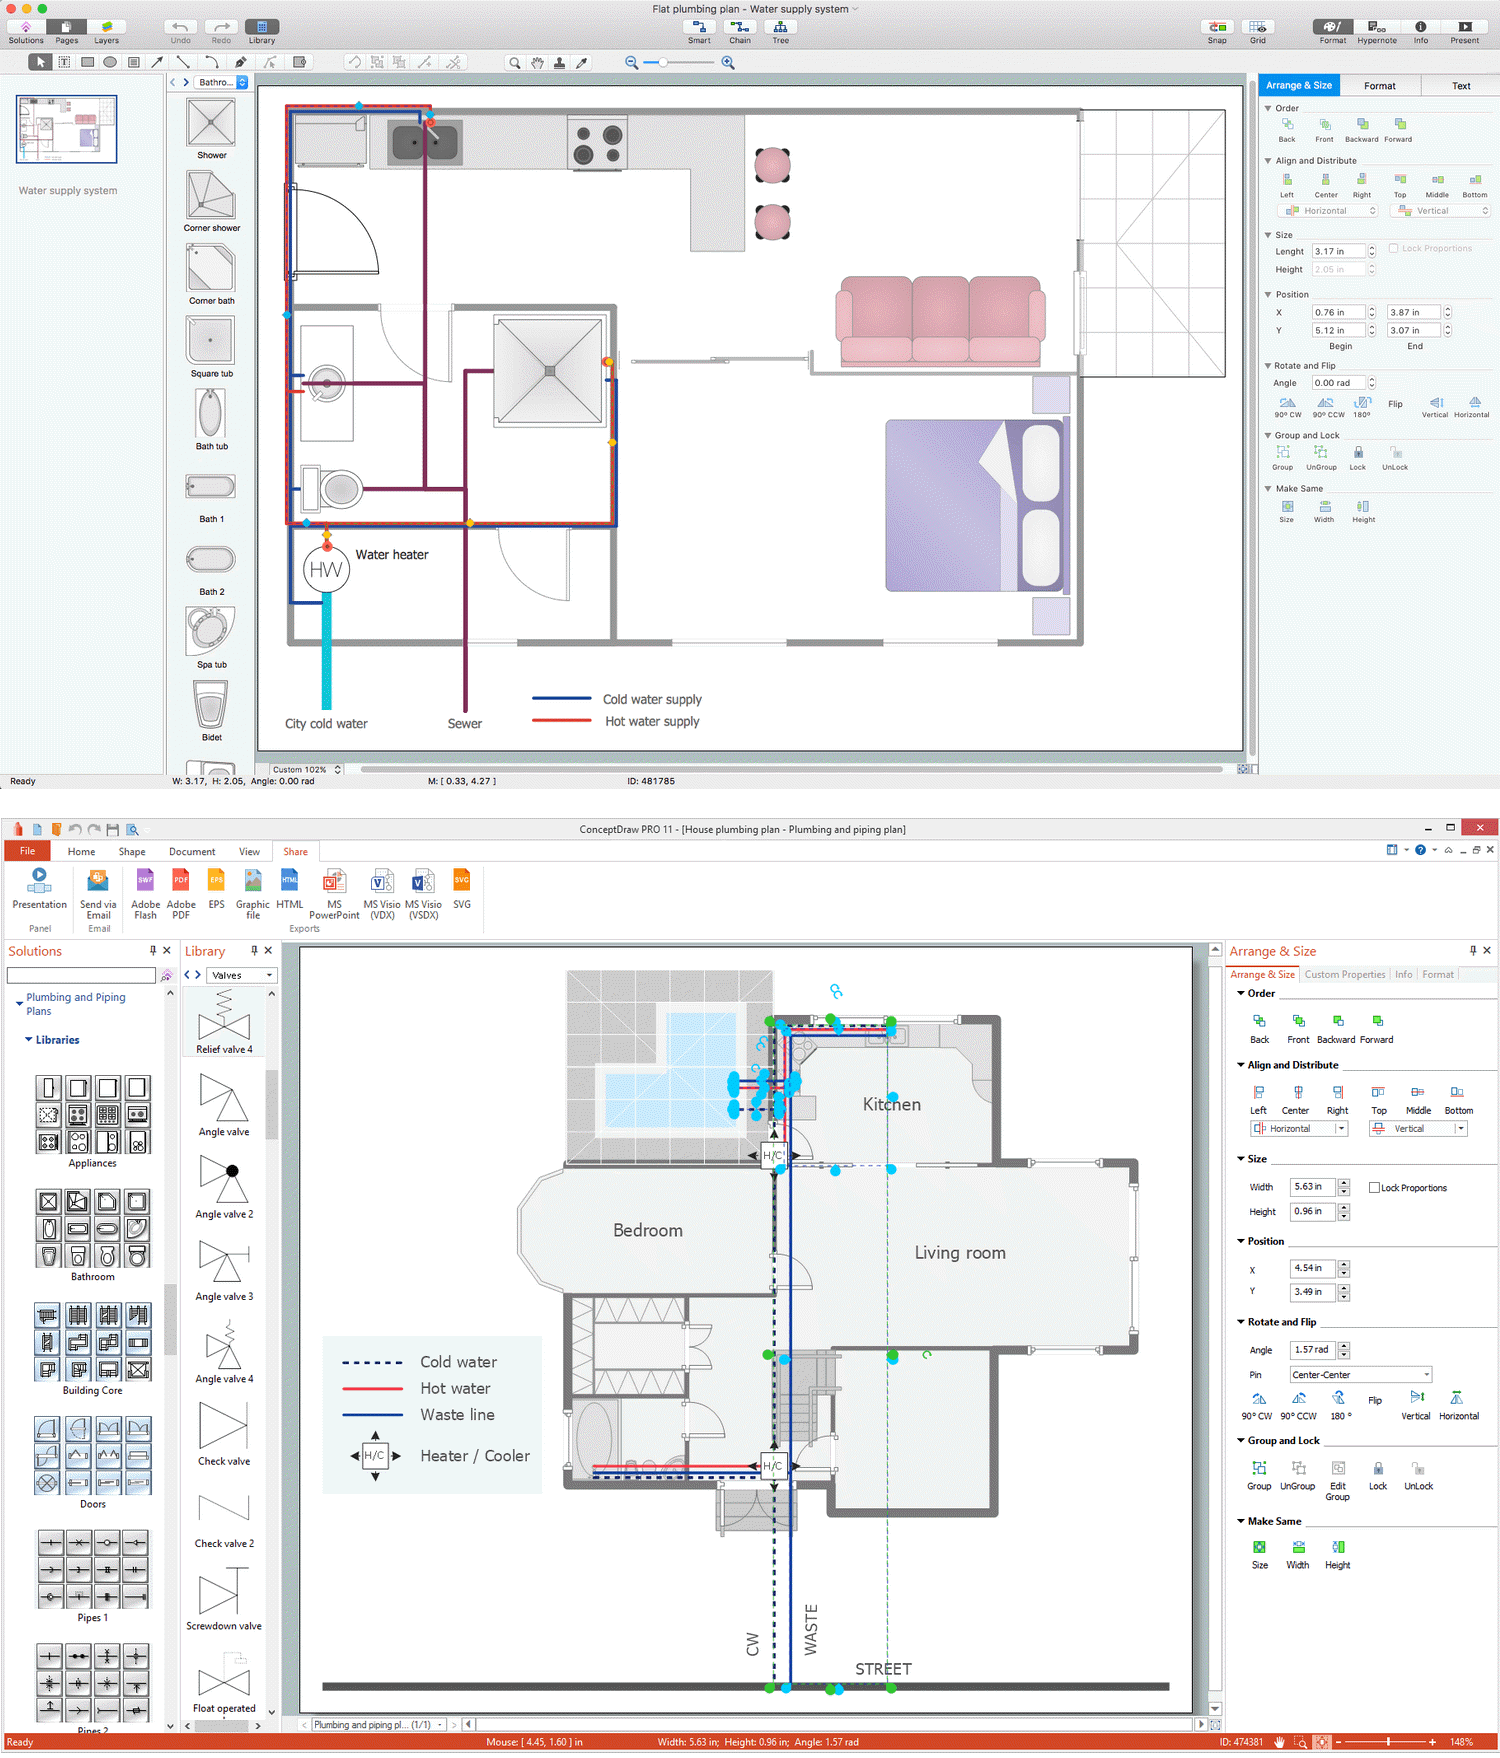
Piping and Instrumentation Diagram Sample
Plumbing and Piping Plans solution from the Building Plans area of ConceptDraw Solution Park contains a large number of templates and samples.

Pic. 3. Piping and Instrumentation Diagram solution
This sample was created in ConceptDraw DIAGRAM using the Plumbing and Piping Plans solution and shows the Piping and Instrumentation Diagram of the house.

Pic. 4. Piping and Instrumentation Diagram Sample
Use ConceptDraw DIAGRAM diagramming and vector drawing software enhanced with Building Plans solution to draw your own plumbing & piping plans, schematic diagrams, blueprints, annotated diagrams or technical drawings of waste water disposal systems, hot and cold water supply systems, water lines, plumbing systems and waste water engineering.
The Piping and Instrumentation Diagrams produced with ConceptDraw DIAGRAM are vector graphic documents and are available for reviewing, modifying, converting to a variety of formats (image, HTML, PDF file, MS PowerPoint Presentation, Adobe Flash or MS Visio), printing and send via e-mail in one moment.
Read more about Home and Landscape design
TEN RELATED HOW TO's:
When trying to figure out the nature of the problems occurring within a project, there are many ways to develop such understanding. One of the most common ways to document processes for further improvement is to draw a process flowchart, which depicts the activities of the process arranged in sequential order — this is business process management. ConceptDraw DIAGRAM is business process mapping software with impressive range of productivity features for business process management and classic project management. This business process management software is helpful for many purposes from different payment processes, or manufacturing processes to chemical processes. Business process mapping flowcharts helps clarify the actual workflow of different people engaged in the same process. This samples were made with ConceptDraw DIAGRAM — business process mapping software for flowcharting and used as classic visio alternative because its briefly named "visio for mac" and for windows, this sort of software named the business process management tools.
This flowchart diagram shows a process flow of project management. The diagram that is presented here depicts the project life cycle that is basic for the most of project management methods. Breaking a project into phases allows to track it in the proper manner. Through separation on phases, the total workflow of a project is divided into some foreseeable components, thus making it easier to follow the project status. A project life cycle commonly includes: initiation, definition, design, development and implementation phases. Distinguished method to show parallel and interdependent processes, as well as project life cycle relationships. A flowchart diagram is often used as visual guide to project. For instance, it used by marketing project management software for visualizing stages of marketing activities or as project management workflow tools. Created with ConceptDraw DIAGRAM — business process mapping software which is flowcharting visio alternative or shortly its visio for mac, this sort of software platform often named the business process management tools.
Picture: Process Flowchart
Related Solution:
To maintain big and complex mechanical systems, you need an appropriate education and tools. It’s needless to say that mechanical drawing is important part of any industrial project. There are a lot of standard symbols depicting valves, pumps, motors, etc.
This drawing illustrates the content of the Fluid Power Equipment library provided by the ConceptDraw Mechanical Engineering solution. The solution is composed from the 8 libraries, containing about 500 elements related to mechanical engineering visualization. it will be helpful for drawing various schemes, charts and blueprints of pneumatic, and hydraulic equipment or other drawing related mechanical engineering. All drawings can be freely resized without loss of quality due to the vector graphics components of its facilities.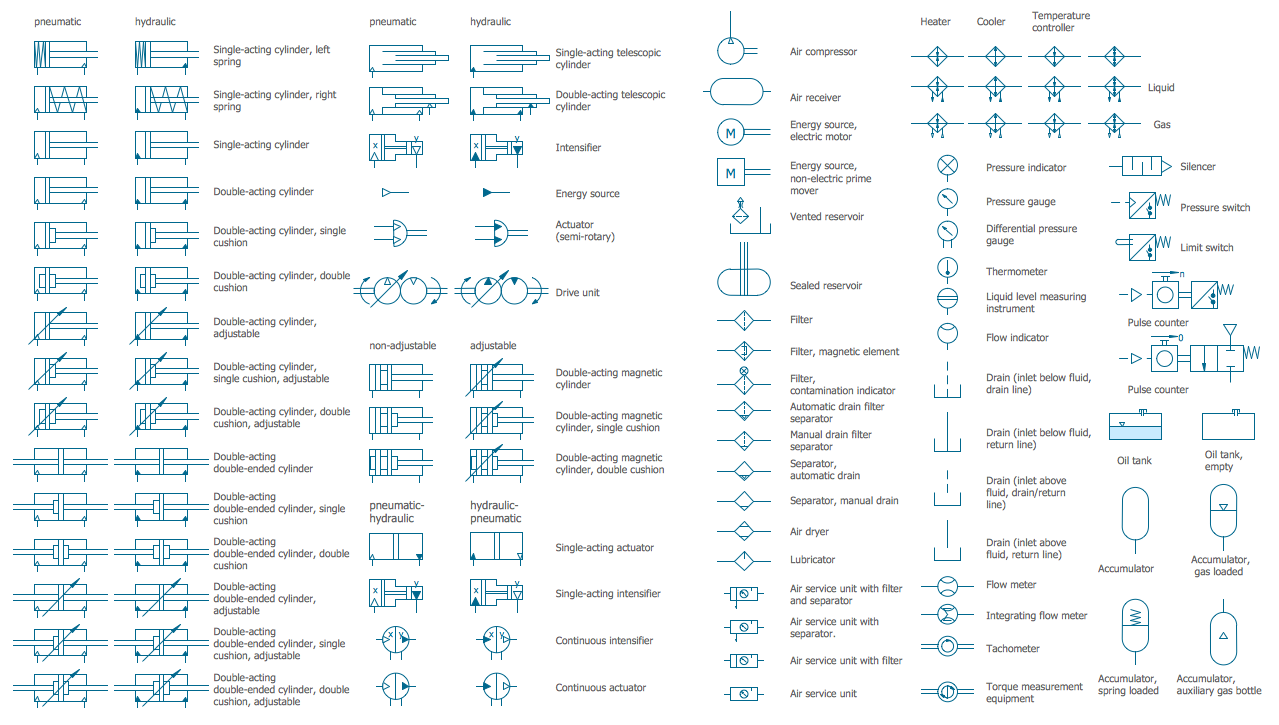
Picture: Mechanical Drawing Symbols
Related Solution:
Chemical and Process Engineering solution contains variety predesigned process flow diagram elements relating to instrumentation, containers, piping and distribution necessary for chemical engineering, and can be used to map out chemical processes or easy creating various Chemical and Process Flow Diagrams in ConceptDraw DIAGRAM.
Picture: Process Flow Diagram Symbols
Related Solution:
If you need create a Process and Instrumentation Diagram, it is convenient to design it in ConceptDraw DIAGRAM software which offers powerful Chemical and Process Engineering Solution from the Industrial Engineering Area.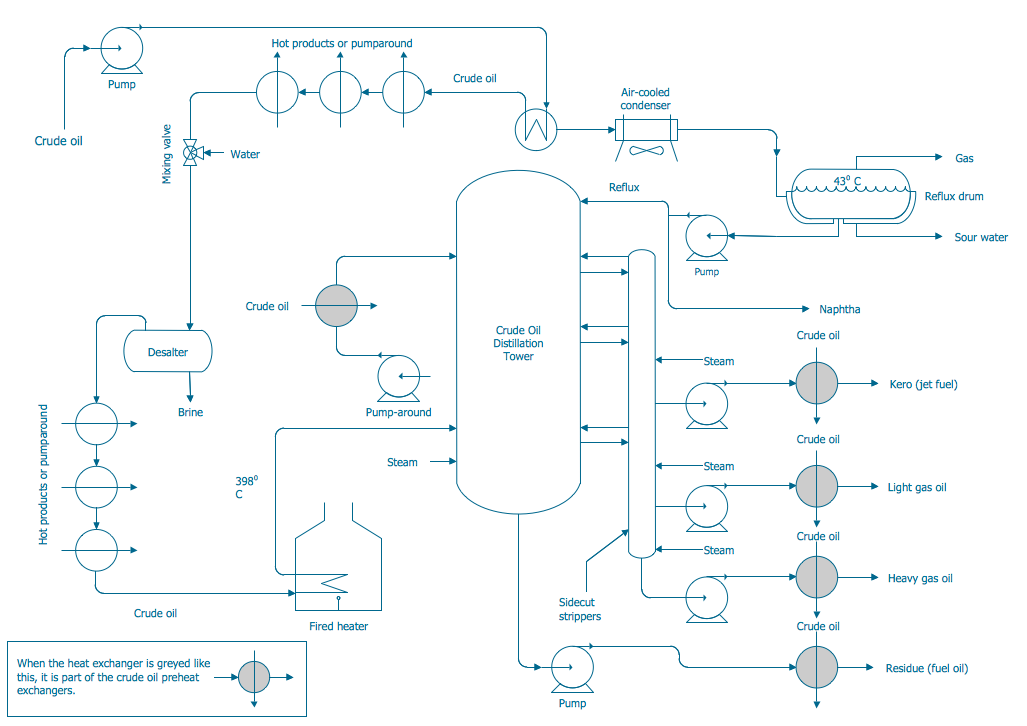
Picture: Process and Instrumentation Diagram
Related Solution:
High competition among the restaurants at the food court requires original design ideas. To attract visitors and increase sales are used many kinds of advertising products, brightly colored signboards, menus and show-cases, often are used the molds of beautifully decorated dishes. Now designing of colorful F&B (food and beverage) materials is easier than ever thanks to the ConceptDraw DIAGRAM diagramming and vector drawing software extended with Food Court Solution from the Food and Beverage Area of ConceptDraw Solution Park.
Picture: F&B
Related Solution:
Digital electronics or digital (electronic) circuits are electronics that handle digital signals – discrete bands of analog levels – rather than by continuous ranges (as used in analogue electronics). All levels within a band of values represent the same numeric value. Because of this discretization, relatively small changes to the analog signal levels due to manufacturing tolerance, signal attenuation or parasitic noise do not leave the discrete envelope, and as a result are ignored by signal state sensing circuitry.
26 libraries of the Electrical Engineering Solution of ConceptDraw DIAGRAM make your electrical diagramming simple, efficient, and effective. You can simply and quickly drop the ready-to-use objects from libraries into your document to create the electrical diagram.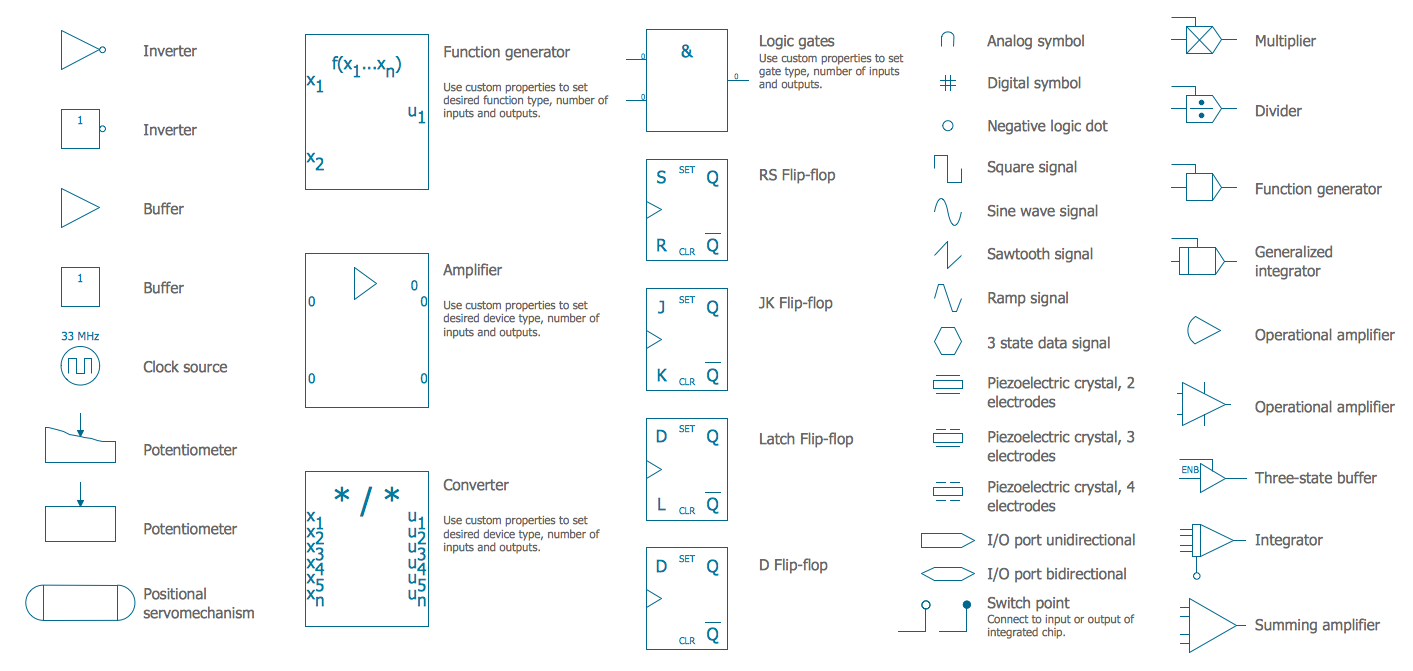
Picture: Electrical Symbols — Analog and Digital Logic
Related Solution:
A thermocouple is an electrical device consisting of two different conductors forming electrical junctions at differing temperatures. A thermocouple produces a temperature-dependent voltage as a result of the thermoelectric effect, and this voltage can be interpreted to measure temperature. Thermocouples are a widely used type of temperature sensor.
26 libraries of the Electrical Engineering Solution of ConceptDraw DIAGRAM make your electrical diagramming simple, efficient, and effective. You can simply and quickly drop the ready-to-use objects from libraries into your document to create the electrical diagram.
Picture: Electrical Symbols — Thermo
Related Solution:
Every engineering project starts from a terms of reference document. The next stage of developing is a technical drawing, which requires using appropriate software. However, revisions and discussions about requirements are possible at any stage of development.
This technical drawing demonstrates a schematic flow diagram of pulp reclaiming. This diagram of magnetite pulp reclaiming is created using ConceptDraw Chemical and Process engineering solution, The solution delivers more than 460 vector graphic icons and connectors. Generally, it is intended for designing process and instrumentation diagrams (P&ID) for chemical and process engineering. block flow diagrams (BFD), process flow diagrams (PFD) for chemical industry.
Picture: Technical Drawing Software
Related Solution:
A database is a data collection, structured into some conceptual model. Two most common approaches of developing data models are UML diagrams and ER-model diagrams. There are several notations of entity-relationship diagram symbols and their meaning is slightly different. Crow’s Foot notation is quite descriptive and easy to understand, meanwhile, the Chen notation is great for conceptual modeling.
An entity relationship diagrams look very simple to a flowcharts. The main difference is the symbols provided by specific ERD notations. There are several models applied in entity-relationship diagrams: conceptual, logical and physical. Creating an entity relationship diagram requires using a specific notation. There are five main components of common ERD notations: Entities, Actions, Attributes, Cardinality and Connections. The two of notations most widely used for creating ERD are Chen notation and Crow foot notation. By the way, the Crow foot notation originates from the Chen notation - it is an adapted version of the Chen notation.
Picture: ERD Symbols and Meanings
Related Solution:


