Percentage Pie Chart. Pie Chart Examples
This sample was created in ConceptDraw DIAGRAM diagramming and vector drawing software using the Pie Charts Solution from Graphs and Charts area of ConceptDraw Solution Park.
This sample shows the Pie Chart of the approximate air composition. You can see the percentage of oxygen, nitrogen and other gases in the air visualized on this Pie Chart.

Example 1. Percentage Pie Chart
Using the ready-to-use predesigned objects from the Pie Charts Solution for ConceptDraw DIAGRAM you can create your own professional looking Pie Charts quick and easy.
The Pie Charts produced with ConceptDraw DIAGRAM are vector graphic documents and are available for reviewing, modifying, and converting to a variety of formats (image, HTML, PDF file, MS PowerPoint Presentation, Adobe Flash or MS Visio).
Free Download Pie Chart Software and View All Examples and Templates
See also Samples:
TEN RELATED HOW TO's:
ConceptDraw DIAGRAM charting and vector drawing software offers the Circle Spoke Diagram Template included to the Business Diagrams Solution from the Management Area. The use of ready template is the easiest way of drawing professional-looking Circle-Spoke Diagrams.
Picture: Circle Spoke Diagram Template
Related Solution:
Electrical plan is a document that is developed during the first stage of the building design. This scheme is composed of conventional images or symbols of components that operate by means of electric energy. To simplify the creation of these schemes you can use house electrical plan software, which will not require a long additional training to understand how to use it. You only need to install the necessary software ant it’s libraries and you’ll have one less problem during the building projection.
Any building contains a number of electrical systems, including switches, fixtures, outlets and other lightening equipment. All these should be depicted in a building electrical plans and included to general building documentation. This home electrical plan displays electrical and telecommunication devices placed to a home floor plan. On the plan, each electrical device is referenced with the proper symbol. Electrical symbols are used for universal recognition of the building plan by different persons who will be working on the construction. Not all possible electric symbols used on a certain plan, so the symbols used in the current home plan are included to a legend. The electrical home plan may be added as a separate document to a complete set of building plans.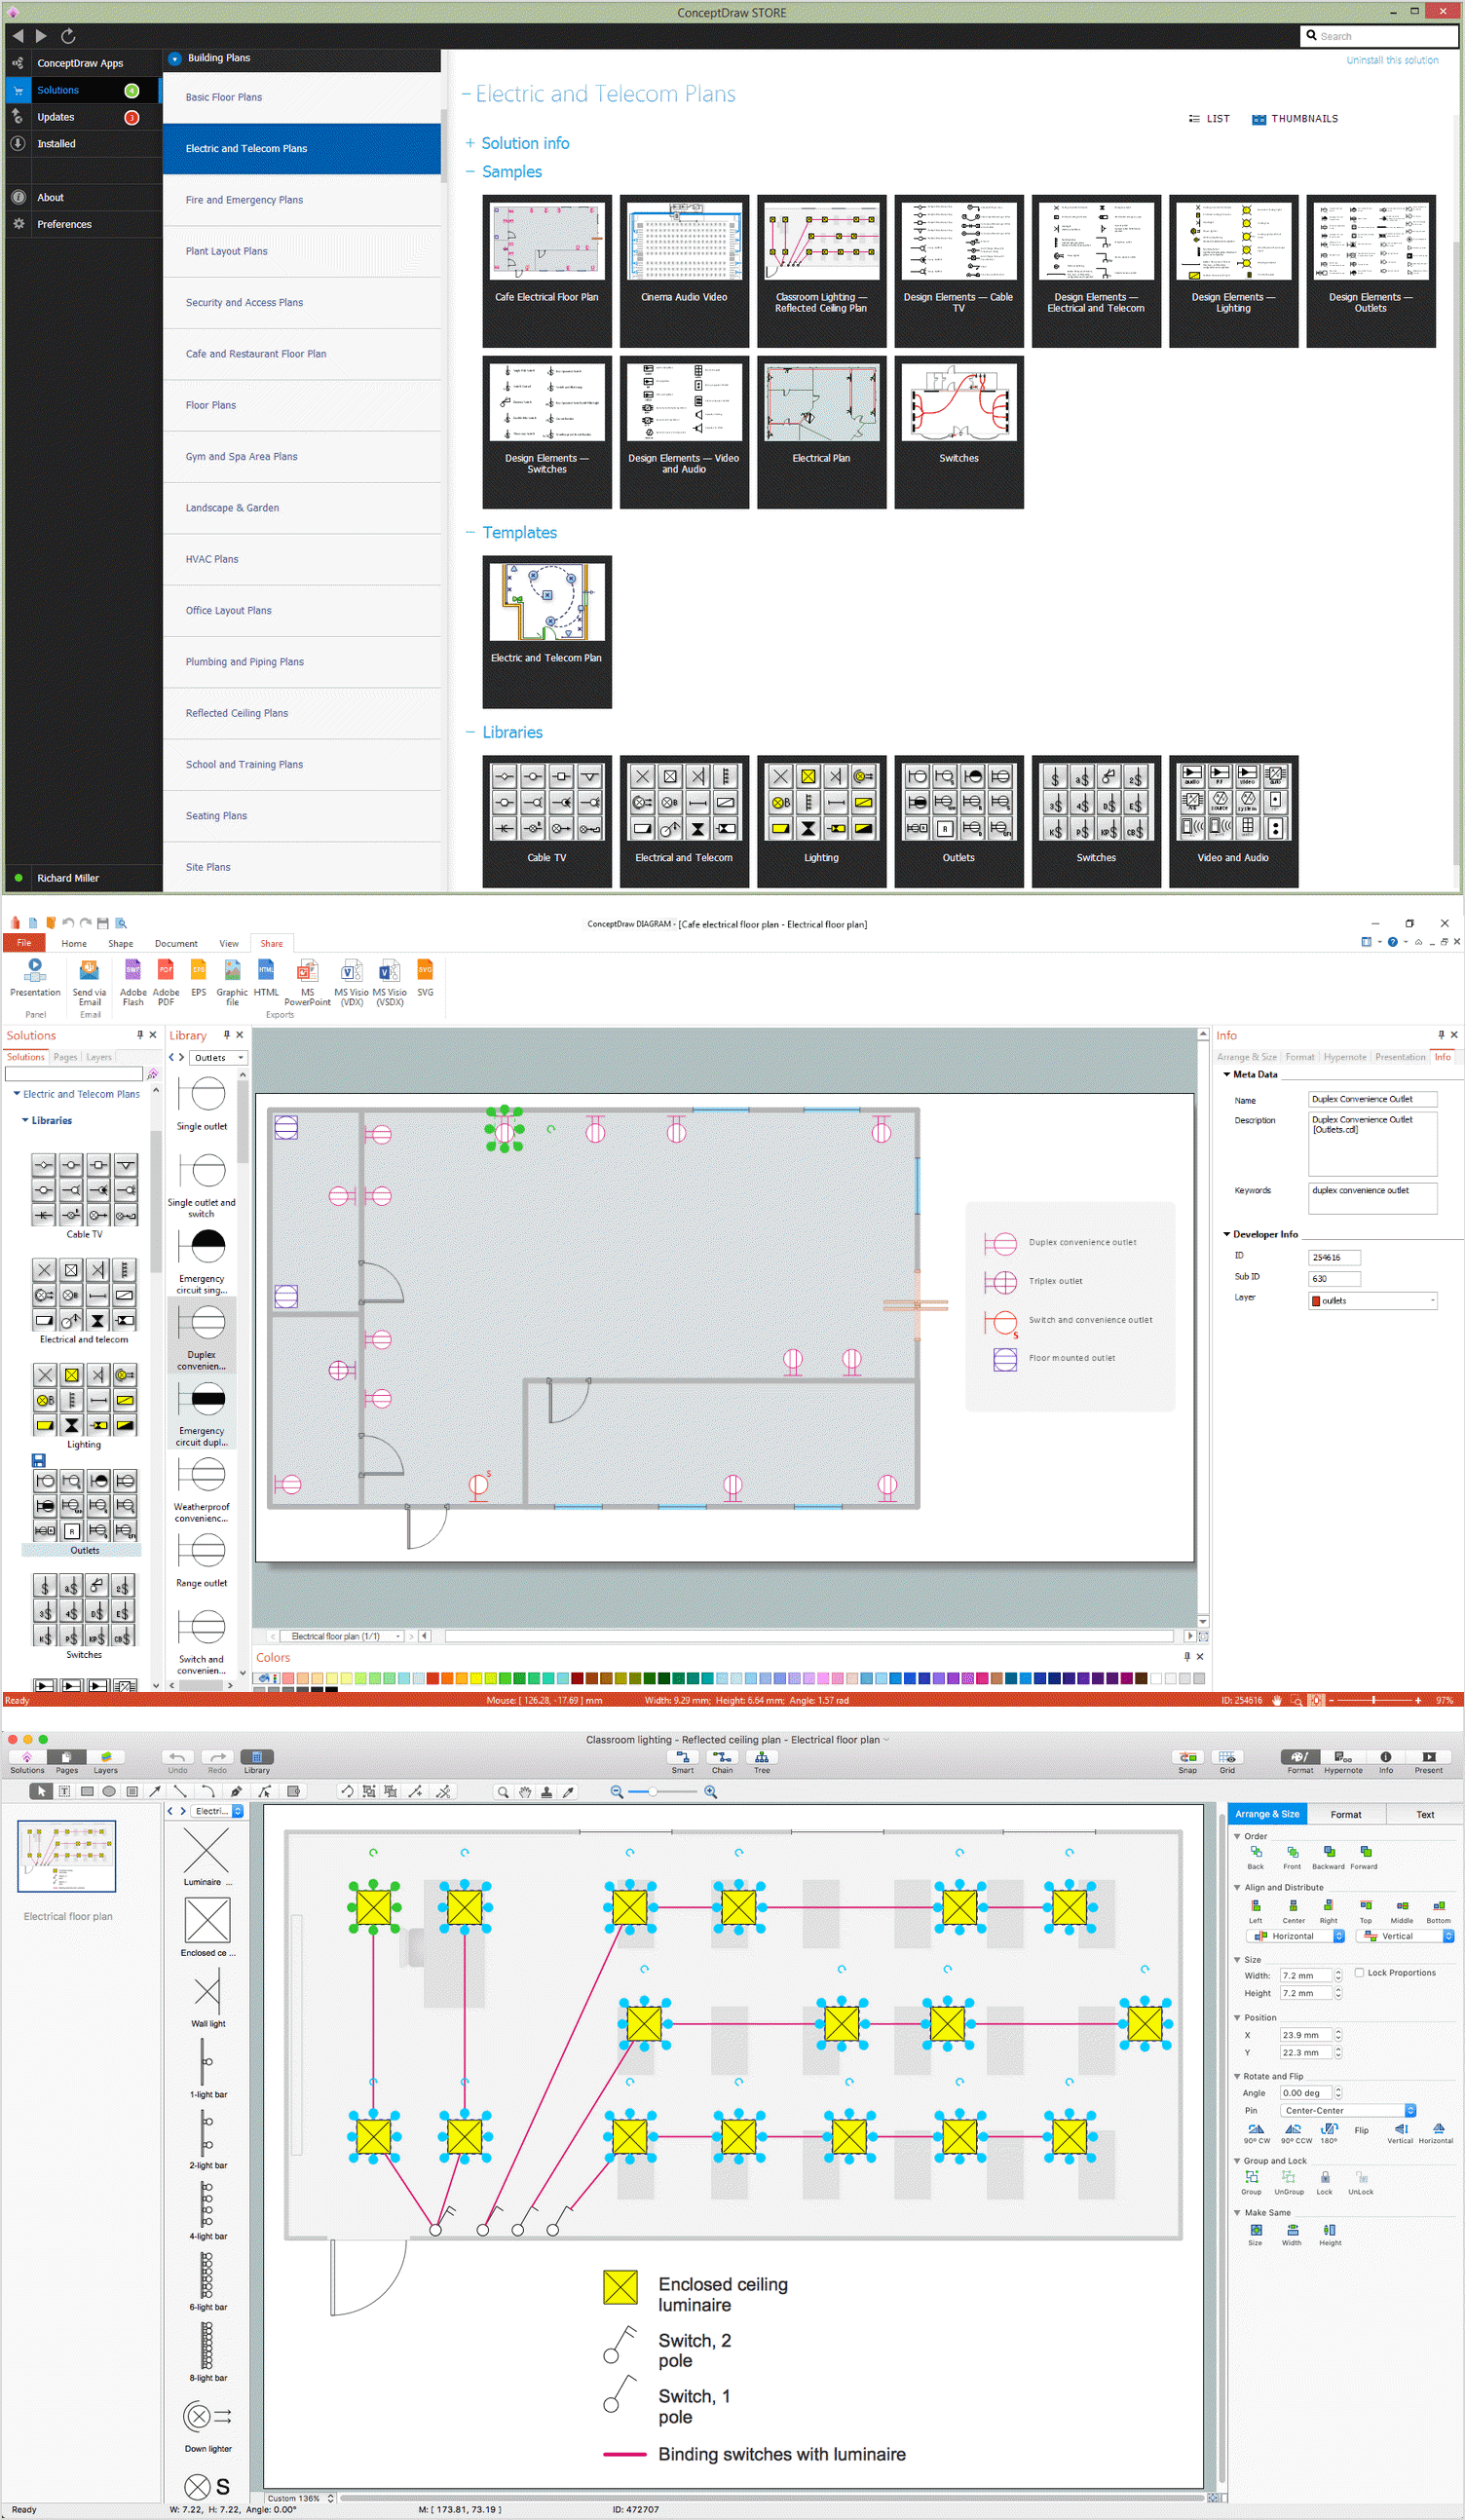
Picture: How To use House Electrical Plan Software
Related Solution:
It is an innovative combination of interactive flow charts and action mind maps to help you boost your social media success.
Picture: Social Media Response Management Action Maps - software tool
Related Solution:
A requisition form is one of the documents used for accounting in different manufacturing processes. There are two main types of requisition: a purchasing requisition and material requisition and difference between them is significant. Creating a flowchart might help you in understanding all the details of accounting process.
Flowcharts are a best visual method for dividing a large and complicated procedure into a several little clear pieces. The main value-ability of an effective flowchart is its simpleness. Material requisition flowcharts are used to document the process of relationships between the different departments and the purchasing department within an organization. The flow chart gives the step-by-step guide on how is carried out the procurement process of the materials necessary for the functioning of the organization. This type of flowchart along with many other business flowcharts, one can easy create using ConceptDraw Flowcharts solution.
Picture: Material Requisition Flowchart. Flowchart Examples
Related Solution:
What is a Picture Graph? It's one of the most useful way which allows explain the information, statistical data in a visual form using the pictures. ConceptDraw DIAGRAM extended with Picture Graphs solution from the Graphs and Charts area offers you the easiest way of Picture Graphs drawing.
Picture: What Is a Picture Graph?
Related Solution:
Any business process consists from a number of tasks carrying out the certain business goal. It is useful to diagram business processes to ensure that they are as foolproof, logical and sequential as possible. This business process diagram describes a typical booking process flow by the example of a cab booking process. It can be used as a roadmap for any booking system implementation. Diagramming a business process allows you to look at the entire project and take into account all types of possible scenarios. Business process diagram helps you investigate and clarify the process thoroughly so that you can find out how it can be improved. Business process diagram supports team communications by ensuring that each process element is clear and everyone in the team is on the same page.
Sometimes your company brings you less profit than you expect it to be, and it’s difficult to reveal the causes. Maybe it’s time to learn new technologies, because business diagram are easily developed by means of special software, so you won’t make any extra effort. In return, you will increase your productivity and get more done in a less time.
Picture: Business Diagram Software
Related Solutions:
Project progress on web: delivering project status to remote teams and stakeholders via Skype.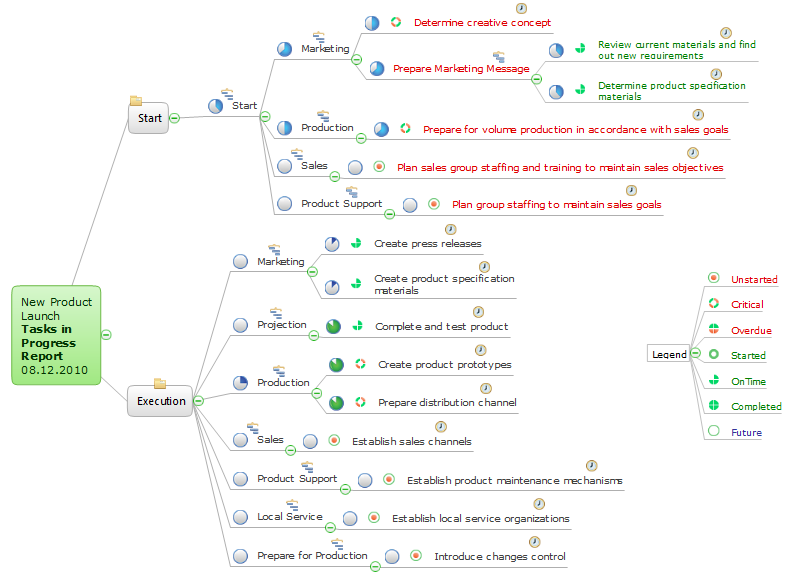
Picture: How To Show Project Progress Peport on Web
Related Solution: