Market Chart
ConceptDraw DIAGRAM is a powerful diagramming and vector drawing software. Each Market Chart designed in it is professional looking, attractive and successful in using thanks to the Marketing Diagrams Solution included in Marketing Area of ConceptDraw Solution Park.
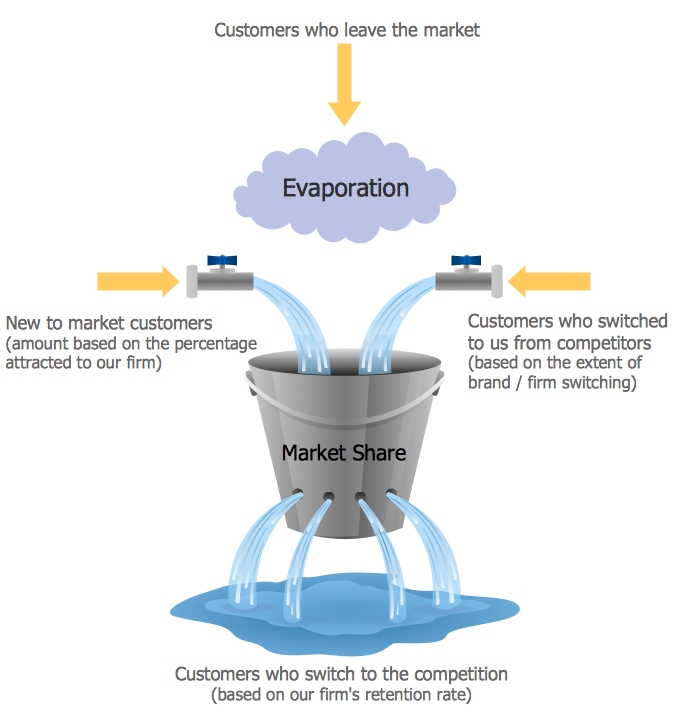
Example 1. Market Chart - Diagram Leaky Bucket
Marketing Diagrams Solution is ideal for drawing the Market Chart in minutes. You need to follow a few steps for this:
- create the new document,
- drag the required shapes from the Marketing Diagrams library included in Marketing Diagrams Solution and arrange them,
- type the text.

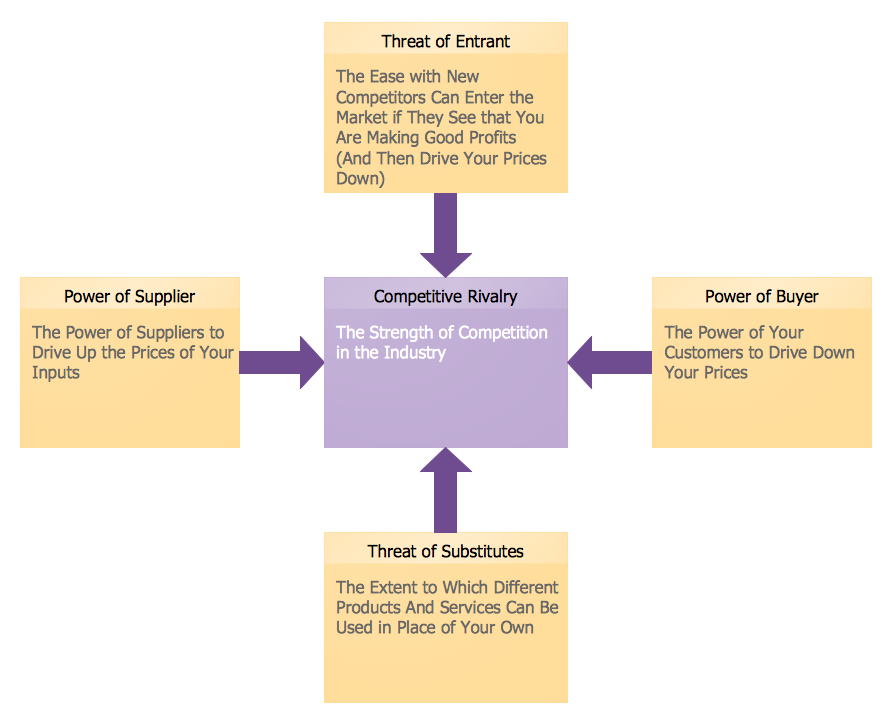
Example 2. Marketing Diagrams Library Design Elements
Marketing Diagrams library contains 11 ready-to-use vector objects. All they are vector objects, you can resize them without loss of quality, change their color to make your market chart more interesting, bright and attractive.

Example 3. Market Chart - Balanced Scorecard Strategy Map
The Market Chart samples you see on this page were created in ConceptDraw DIAGRAM using the tools of the Marketing Diagrams Solution for ConceptDraw DIAGRAM Solution Park. Each of these samples successfully demonstrates solution's capabilities and professional results you can achieve. An experienced user spent 5-10 minutes creating every of them.
Use the Marketing Diagrams Solution for ConceptDraw DIAGRAM software to create your own professionally designed marketing charts, marketing diagrams, market chart quick, easy and effective, and then successfully use them in work or education activity.
All source documents are vector graphic documents. They are available for reviewing, modifying, or converting to a variety of formats (PDF file, MS PowerPoint, MS Visio, and many other graphic formats) from the ConceptDraw STORE. The Marketing Diagrams Solution is available for all ConceptDraw DIAGRAM or later users.