Line Charts
ConceptDraw DIAGRAM diagramming and vector drawing software extended with Line Graphs solution from the Graphs and Charts area of ConceptDraw Solution Park is the best for drawing the Line Charts simply and fast.
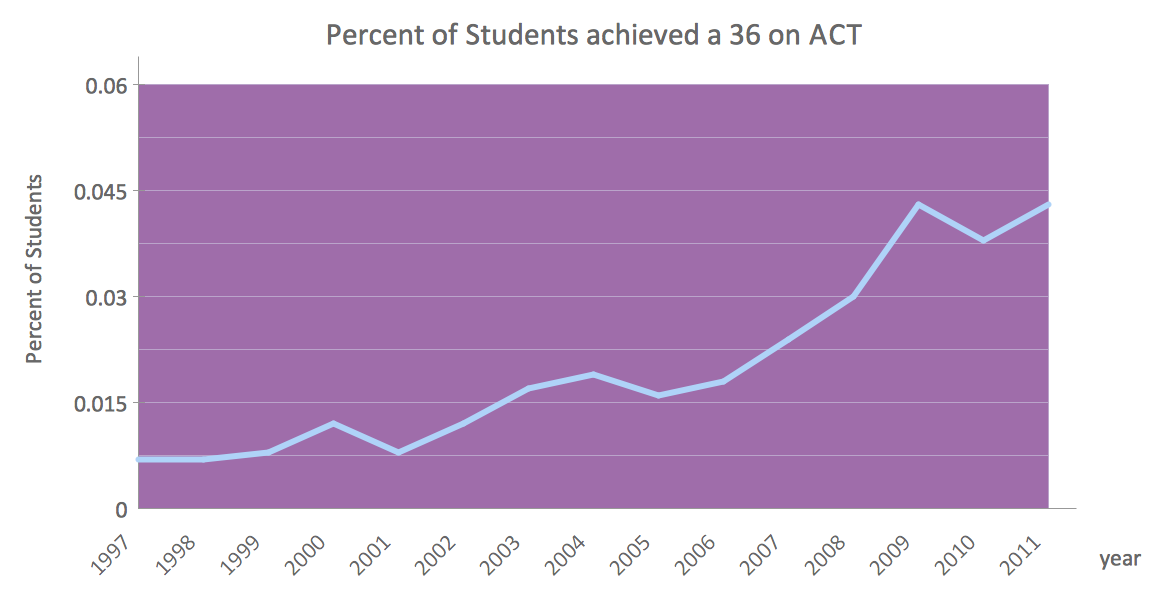
Example 1. Line Charts - Percent of Students achieved a 36 on ACT
Line charts are very popular and widely used and it's the excellent news that now their drawing is so easy thanks to the extended drawing tools of ConceptDraw DIAGRAM templates, samples and Line Graphs library of vector objects included in the Line Graphs Solution.

Example 2. Line Charts - Circuit efficiency Erlang B
Seeing the predesigned line charts examples, you can make sure that line charts designed in ConceptDraw DIAGRAM are professional looking, clear, visual and bright! So they can be successfully used in mathematics, statistics, business, and many other fields for visualizing time series and displaying how data change over time.

Example 3. Line Charts - Number of airlines departures in the given years
The line charts you see on this page were created in ConceptDraw DIAGRAM using the Line Graph Solution for ConceptDraw DIAGRAM An experienced user spent 5-10 minutes creating every of these samples.
Use the Line Graph Solution from the Graphs and Charts area to draw your own line graphs of any complexity quick, easy and effective.
All source documents are vector graphic documents. They are available for reviewing, modifying, or converting to a variety of formats (PDF file, MS PowerPoint, MS Visio, and many other graphic formats) from the ConceptDraw STORE. The Line Graph Solution is available for all ConceptDraw DIAGRAM or later users.
THREE RELATED HOW TO's:
Job duties in small companies are usually spread randomly among workers, causing lots of problems and misunderstanding. One of the ways to restore order in business processing is to create a cross-functional flowchart with swim lanes that would represent every step in production system. Another advantage of using swim lanes flowchart is that it represents not only processes, but people responsible for them.
Swim lane diagram is a kind of a process flow diagram. Its special feature is that it joins the features of process flow diagrams with organizational charts. Thus, a swim lane diagram display a participant of the business process in a conjunction with general flow of the business system. A swim lane diagram is looks similar to a swimming pool's lanes. Lanes can be horizontal and vertical. The lanes are pointed out relatively to resource name, which is assigned on implementation of the given part of the business process. ConceptDraw Business Process Mapping solution delivers the ability to design develop swim lanes flowcharts using the vector graphic objects of Swim Lanes library.
Picture: Swim Lane Diagrams
Related Solution:
In your work activity you need regularly draw the line graphs? And each time you ask yourself a question "How to Draw a Line Graph easier and faster?". The desire to automate the line graphs drawing process led to the creation of Line Graphs solution from Graphs and Charts area of ConceptDraw Solution Park.
Picture: How to Draw a Line Graph
Related Solution:
This sample was created in ConceptDraw DIAGRAM diagramming and vector drawing software using the Line Graphs Solution from Graphs and Charts area of ConceptDraw Solution Park.
This sample shows the Line Chart of annual percentage change. The Line Chart allows you to clearly see the changes of data over the time.
Picture: Line Chart Template for Word
Related Solution:

