Interactive Voice Response System
How to represent the Interactive Voice Response System? The commonly used way is to draw the IVR diagram. You can draw it manually in a graphic editor, but ConceptDraw DIAGRAM diagramming and vector drawing software offers you the more effective way - to use the powerful tools of the Interactive Voice Response Diagrams Solution for ConceptDraw Solution Park.
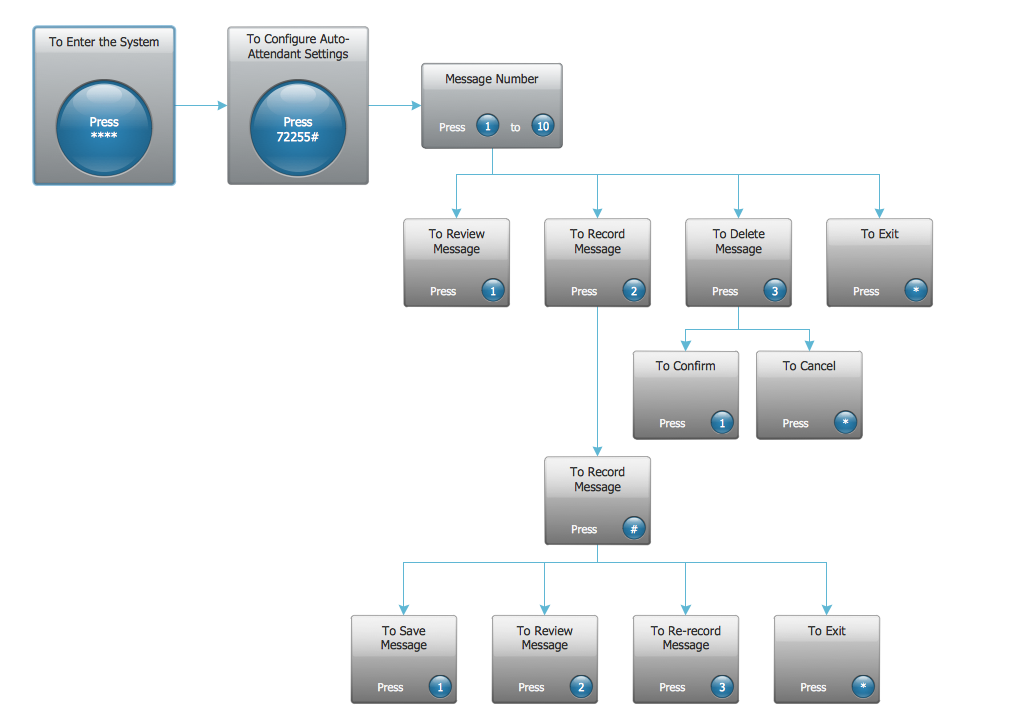
Example 1. Interactive Voice Response System Diagram - IVR Messaging System
Drawing the IVR diagram illustrating the Interactive Voice Response System in ConceptDraw DIAGRAM will take only a few minutes of your time. All elements for IVR diagrams you may need are already predesigned and wait in the Interactive Voice Response library for the Interactive Voice Response Diagrams Solution. You need only drag the desired of them and arrange on your diagram.

Example 2. Interactive Voice Response Library Design Elements
Variety of samples offered in the Interactive Voice Response Diagrams Solution section of ConceptDraw STORE are the good examples of professionally created IVR diagrams. These samples are free to use as is by ConceptDraw users or can be changed according to their own needs.

Example 3. Interactive Voice Response System Diagram - IVR Mobile Operator
The Interactive Voice Response System Diagrams you see on this page were created in ConceptDraw DIAGRAM using the Interactive Voice Response Diagrams Solution for ConceptDraw DIAGRAM They are available from ConceptDraw STORE. An experienced user spent 10 minutes creating every of them.
Use Interactive Voice Response Diagrams Solution for ConceptDraw DIAGRAM software to illustrate the Interactive Voice Response System of any complexity quick, easy and effective.
All source documents are vector graphic documents. They are available for reviewing, modifying, or converting to a variety of formats (PDF file, MS PowerPoint, MS Visio, and many other graphic formats) from the ConceptDraw STORE. The Interactive Voice Response Diagrams Solution is available for all ConceptDraw DIAGRAM or later users.
FIVE RELATED HOW TO's:
When trying to figure out the nature of the problems occurring within a project, there are many ways to develop such understanding. One of the most common ways to document processes for further improvement is to draw a process flowchart, which depicts the activities of the process arranged in sequential order — this is business process management. ConceptDraw DIAGRAM is business process mapping software with impressive range of productivity features for business process management and classic project management. This business process management software is helpful for many purposes from different payment processes, or manufacturing processes to chemical processes. Business process mapping flowcharts helps clarify the actual workflow of different people engaged in the same process. This samples were made with ConceptDraw DIAGRAM — business process mapping software for flowcharting and used as classic visio alternative because its briefly named "visio for mac" and for windows, this sort of software named the business process management tools.
This flowchart diagram shows a process flow of project management. The diagram that is presented here depicts the project life cycle that is basic for the most of project management methods. Breaking a project into phases allows to track it in the proper manner. Through separation on phases, the total workflow of a project is divided into some foreseeable components, thus making it easier to follow the project status. A project life cycle commonly includes: initiation, definition, design, development and implementation phases. Distinguished method to show parallel and interdependent processes, as well as project life cycle relationships. A flowchart diagram is often used as visual guide to project. For instance, it used by marketing project management software for visualizing stages of marketing activities or as project management workflow tools. Created with ConceptDraw DIAGRAM — business process mapping software which is flowcharting visio alternative or shortly its visio for mac, this sort of software platform often named the business process management tools.
Picture: Process Flowchart
Related Solution:
When thinking about data visualization, one of the first tools that comes to mind is a flowchart design. You can find flowchart symbols, shapes, stencils and icons easily on the Internet, but it might take time to systematize this information. Nevertheless, once you start flowcharting, you’ll love its simplicity and efficiency.
This diagram consists from standard flowchart symbols, approved by ANSI (American National Standard Institute) for drawing flowcharts. A flowchart is a diagram that represents a step-by-step algorithm of any process, displaying the process stages as boxes that are connected with arrows. Flowchart design makes it clear and readable.
Flowchart designed using ConceptDraw DIAGRAM flowchart software allows to make attractive and clear process presentation, it makes interpretation of the business process flow fresh and versatile. Great flowchart design view is a big advantage over the diagram created manually on a paper.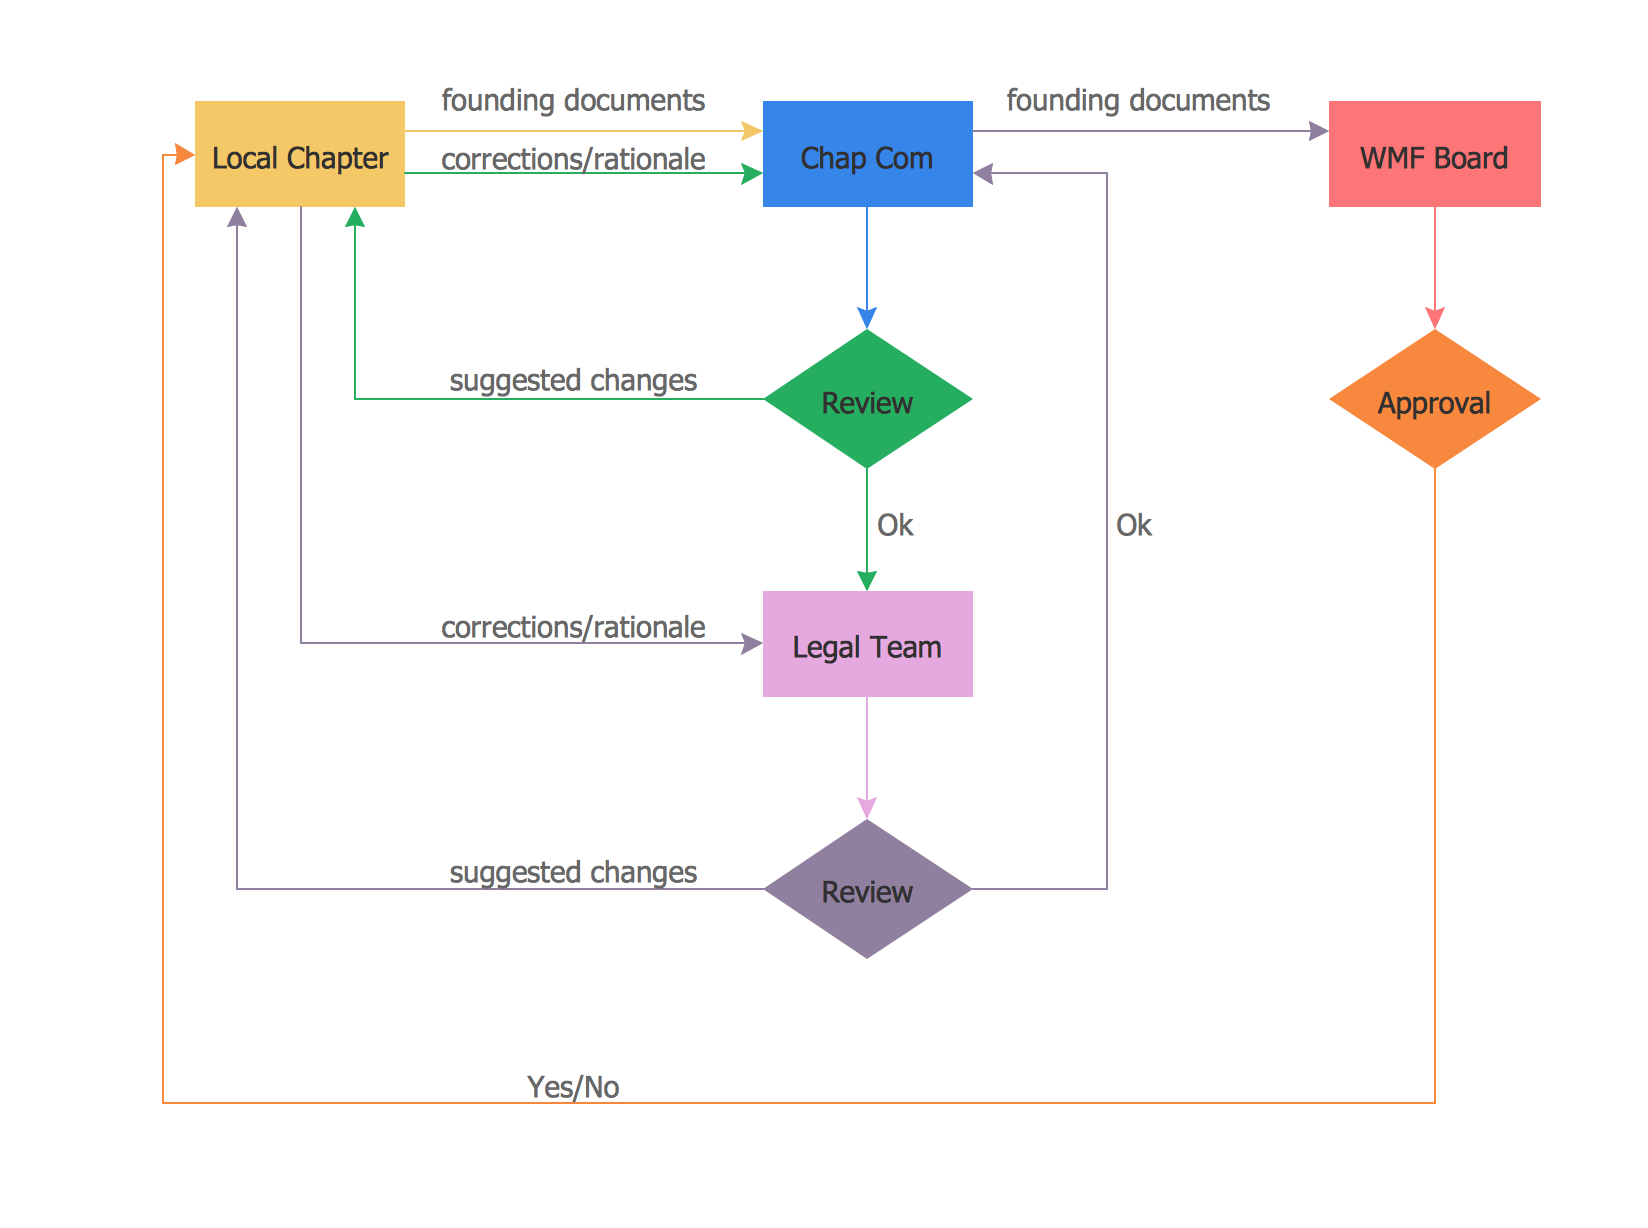
Picture: Flowchart design. Flowchart symbols, shapes, stencils and icons
Related Solution:
Nodes of any computer network are somehow organized in a hierarchy or a layout. Some of the common layouts like star network topology are more reliable and some like ring topology withstand high loads better. It is also important to distinguish logical topologies from physical.
This diagram represents a typical view of the star network topology. The star network topology is one of the most frequently used network topologies in the majority of office and home networks. It is very popular because of its low cost and the easy maintenance. The plus of the star network topology is that if one computer on the local network is downed, this means that only the failed computer can not send or receive data. The other part of the network works normally. The minus of using star network topology is that all computers are connected to a single point-switch, or hub. Thus, if this equipment goes down, the whole local network comes down.
Picture: Star Network Topology
Related Solution:

