Made with
ConceptDraw
DIAGRAM 17

Infographic Tools

ConceptDraw DIAGRAM diagramming and vector drawing software offers the best infographic tools - Data-driven Infographics Solution from the “Infographics” Area of ConceptDraw Solution Park.

Infographic Tools *

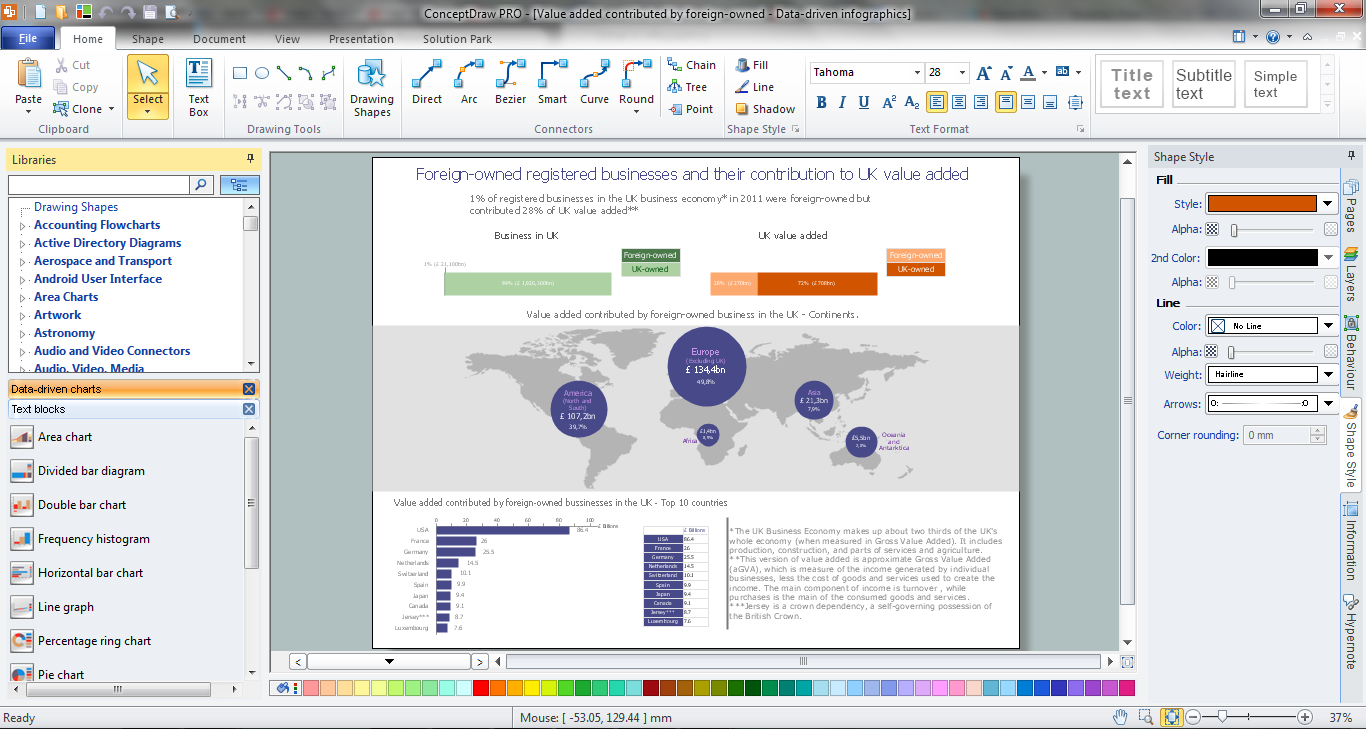
Example 1. Infographic Tools of ConceptDraw DIAGRAM /p>

Among all infographic tools offered by Data-driven Infographics Solution the most main importance have the smart vector objects offered by the Data-driven Charts library. You can easy sure this - you need merely change the data at the table and the object view will change automatically in one moment.

Data-driven Charts Library Design Elements

Example 2. Data-driven Charts Library Design Elements

You will also benefit from the predesigned samples included in the Data-driven Infographics Solution. All they are clear and useful examples, and also can become the good source of inspiration for self-dependent professional drawing.

Data-driven Infographics - Effects of Taxes and Benefits

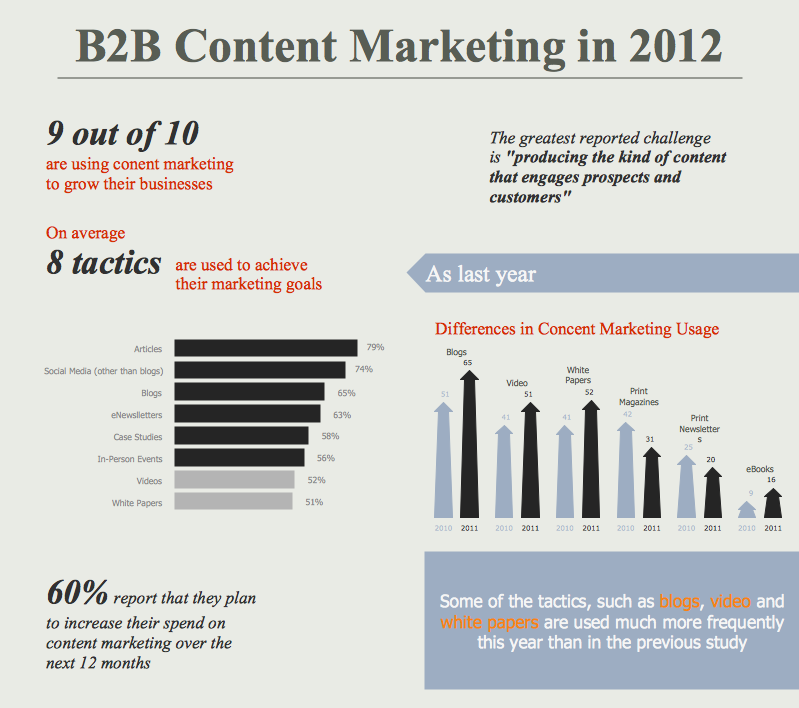
Example 3. Data-driven Infographics - Effects of Taxes and Benefits

The Data-driven Infographics samples you see on this page were created in ConceptDraw DIAGRAM software using the infographics tools of the Data-driven Infographics Solution. They successfully demonstrate solution's capabilities and professional results you can achieve. An experienced user spent 10 minutes creating each of them.

Use the best infographic tools of Data-driven Infographics Solution for ConceptDraw DIAGRAM Solution Park for effective creating the Data-driven Infographics.

All source documents are vector graphic documents. They are available for reviewing, modifying, or converting to a variety of formats (PDF file, MS PowerPoint, MS Visio, and many other graphic formats) from the ConceptDraw STORE. The Data-driven Infographics Solution is available for all ConceptDraw DIAGRAM or later users.


FIVE RELATED HOW TO's:
A concept map is a way of representing relationships between ideas, images, or words. How to draw a Concept Map quick, easy and effective? ConceptDraw DIAGRAM offers the unique Concept Maps Solution from the "Diagrams" Area that will help you!Concept Map *
Picture: Concept Map
Related Solution:
The popularity of visual content marketing grows day by day. So now simple and convenient designing of professional looking Content Marketing Infographics becomes increasingly actual. For achievement this goal ConceptDraw DIAGRAM software offers the Marketing Infographics Solution from the Business Infographics Area.Content Marketing Infographics *
Picture: Content Marketing Infographics
Related Solution:
It is impossible to imagine mechanical engineering without drawings which represent various mechanical schemes and designs. ConceptDraw DIAGRAM diagramming and vector drawing software supplied with Mechanical Engineering solution from the Engineering area of ConceptDraw Solution Park offers the set of useful tools which make it a powerful Mechanical Drawing Software.Mechanical Drawing Software *
Picture: Mechanical Drawing Software
Related Solution:
A scatter plot is also known to be called as a scatter graph, scatterplot, scatter chart, scatter diagram or scattergram. It is a type of a plot or mathematical diagram and to make it the Cartesian coordinates can be used for displaying the numeral values for usually two variables for one set of data.Scatter Plot *
Picture: Scatter Plot
Related Solution:
You want design Pictorial Chart or Infographic? And you need powerful infographic software? Then ConceptDraw DIAGRAM diagramming and vector drawing software extended with Pictorial Infographics Solution from the “Infographics” Area is exactly what you need.Pictorial Chart *
Picture: Pictorial Chart
Related Solution:
ConceptDraw
DIAGRAM 17