Infographic Maker
Infographic is a visual way of representing various information, data, knowledge in statistics, geography, journalism, education, and much more areas.
ConceptDraw DIAGRAM supplied with Pictorial Infographics Solution from the “Infographics” Area, provides a set of powerful pictorial infographics tools. Thanks to them it is the best Infographic Maker.

Example 1. Infographic Maker
ConceptDraw DIAGRAM Infographic Maker is ideal infographics software thanks to the Pictorial Infographics Solution which provides the best numerous collection of predesigned pictorial infographics examples and samples, and 10 libraries with variety of predesigned vector pictograms.
Simply type the text and drag the needed pictograms from the libraries to save your time and to create pictorial infographics quick and easy.

Example 2. Pictorial Infographics - World Population
The following features make ConceptDraw DIAGRAM the best Pictorial Infographic Maker:
- You don't need to be an artist to draw professional looking chats in a few minutes.
- Large quantity of ready-to-use vector objects makes your drawing infographics quick and easy.
- Great number of predesigned samples give you the good start for your own pictorial infographics.
- ConceptDraw DIAGRAM provides you the possibility to use the grid, rules and guides. You can easily rotate, group, align, arrange the objects, use different fonts and colors to make your diagram exceptionally looking.
- All ConceptDraw DIAGRAM documents are vector graphic files and are available for reviewing, modifying, and converting to a variety of formats: image, HTML, PDF file, MS PowerPoint Presentation, Adobe Flash, MS Visio.
- Using ConceptDraw STORE you can navigate through ConceptDraw Solution Park, managing downloads and updates. You can access libraries, templates and samples directly from the ConceptDraw STORE.
- If you have any questions, our free of charge support is always ready to come to your aid.
TEN RELATED HOW TO's:
To design line and scatter charts use ConceptDraw DIAGRAM diagramming and vector drawing software extended with Line Graphs solution from Graphs and Charts area of ConceptDraw DIAGRAM Solution Park. (Line chart, scatter chart, 2d chart).
Picture: Line Graph Charting Software
Related Solution:
Chad, officially the Republic of Chad, is a landlocked country in Central Africa.
The vector stencils library Chad contains contours for ConceptDraw DIAGRAM diagramming and vector drawing software. This library is contained in the Continent Maps solution from Maps area of ConceptDraw Solution Park.
Picture: Geo Map - Africa - Chad
Related Solution:
ConceptDraw DIAGRAM extended with Chemistry solution from the Science and Education area is a powerful chemistry drawing software that provides the useful tools to help you design all kinds of chemistry drawings and illustrations, chemical schemes and diagrams of formulas, reaction schemes and lab set-ups of any complexity.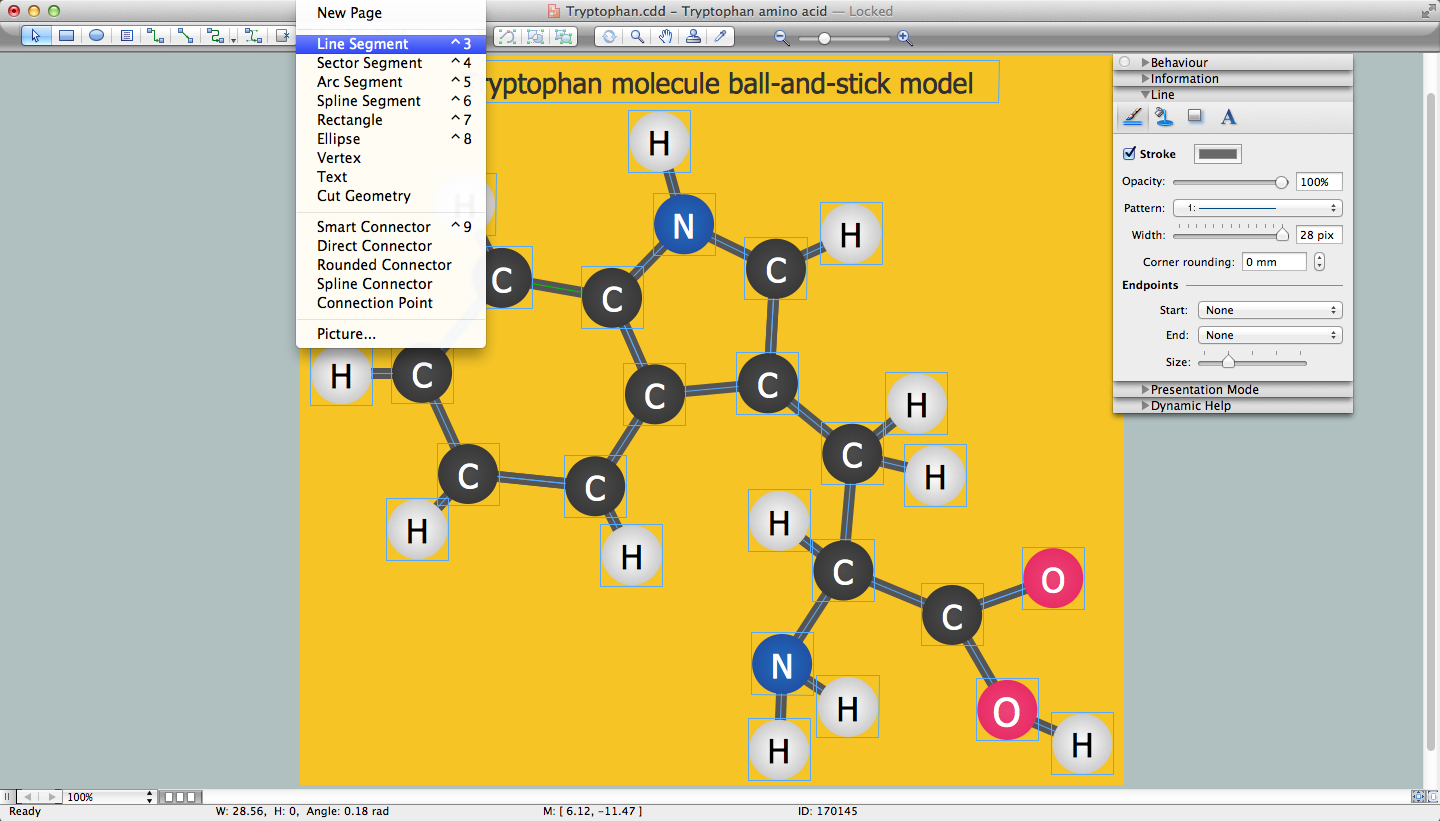
Picture: Chemistry Drawing Software
Related Solution:
Use the Basic Diagramming Solution from the Universal Diagramming area of ConceptDraw Solution Park to easy create simple forms, questionnaires, survey forms, registration and application forms, etc.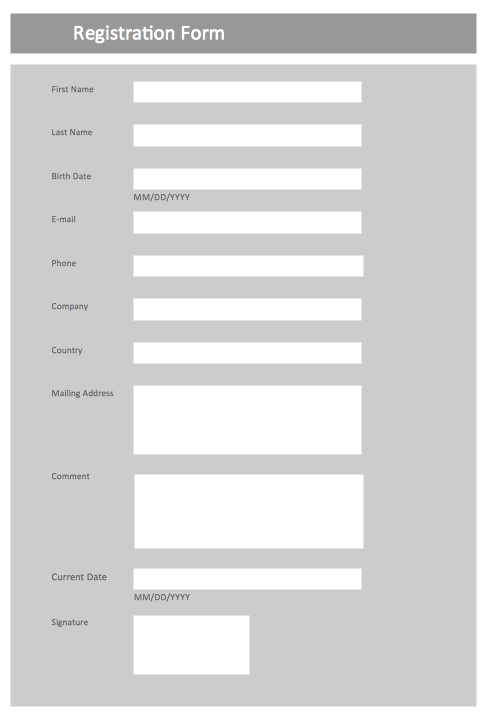
Picture: Form Maker
Related Solution:
What Is a Line Chart? A line chart is a basic type of chart represented by a series of data points connected with a straight line. Explaining the meaning of “What is a line chart?” is convenient to use illustrations with professional looking line charts designed in ConceptDraw DIAGRAM diagramming and vector drawing software extended with Line Graphs solution from the Graphs and Charts area.
Picture: What Is a Line Chart
Related Solution:
ConceptDraw DIAGRAM diagramming and vector drawing software extended with Seven Basic Tools of Quality solution from the Quality area of ConceptDraw Solution Park provides effective tools for quality control and helps design any types of quality-related diagrams.
Picture: Seven Basic Tools of Quality — Quality Control
Related Solution:
Sample Pictorial Chart - Pictorial Infographics solution provides easy-to-use design infographics drawing tools, large collection of different sample infographics and infograms, sample pictorial chart and templates to be filled in, and 10 libraries with great quantity of predesigned vector pictograms.
Use Pictorial Infographics solution to draw your own design pictorial infographics documents quick and easy.
Picture: Sample Pictorial Chart. Sample Infographics
Related Solution:


