Improving Problem Solving and Focus with Fishbone Diagrams
When you need to focus on the problem, professional diagramming tool helps you create a Fishbone diagram also known as Ishikawa diagram. Understanding of the problem via Fishbone diagram will improve the processes between departments and teams.
ConceptDraw DIAGRAM extended with Fishbone Diagrams solution gives a powerful tool for improving problem solving and focus with Fishbone diagrams. Fishbone diagram depicts in one diagram all factors of Equipment, Process, People, Materials, Environment and Management, affecting on a given problem for the further analysis. Construct Fishbone diagram, identify many possible causes for an effect and focus on them for improving problem solving.

Example 1. Improving Problem Solving and Focus with Fishbone Diagrams
The easiest way of drawing Fishbone diagram in ConceptDraw is to create it from templates offered in quantity by Fishbone Diagrams Solution at ConceptDraw STORE. Here you can find the set of templates for ConceptDraw DIAGRAM and also for ConceptDraw MindMap, and to start with any desired of them. Brainstorming the causes at ConceptDraw MindMap, you have then a possibility to output automatically your data as Fishbone diagram in ConceptDraw DIAGRAM

Example 2. Fishbone Diagram Templates in ConceptDraw STORE
Now, you can change the style of your diagram - change the colors of objects and text, add images and clipart from your computer or other libraries of ConceptDraw Solution Park to illustrate exceptionally your Fishbone Diagram.

Example 3. Fishbone Diagram - Bad Coffee
The samples and templates you see on this page were created in ConceptDraw DIAGRAM using the tools of the Fishbone Diagrams Solution. An experienced user spent 10 minutes creating each of these samples.
Use the Fishbone Diagrams Solution for ConceptDraw DIAGRAM Solution Park for easy and effective improving problem solving and focus with Fishbone diagrams.
All source documents are vector graphic documents. They are available for reviewing, modifying, or converting to a variety of formats (PDF file, MS PowerPoint, MS Visio, and many other graphic formats) from the ConceptDraw STORE. The Fishbone Diagrams Solution is available for all ConceptDraw DIAGRAM or later users.
TEN RELATED HOW TO's:
Fishbone Diagram, also referred as Cause and Effect diagram or Ishikawa diagram, is a fault finding and problem solving tool. Construction of Ishikawa diagrams is quite complicated process and has a number of features.
Fishbone Diagrams solution included to ConceptDraw Solution Park contains powerful drawing tools and a lot of examples, samples and templates. Each Fishbone diagram example is carefully thought-out by experts and is perfect source of inspiration for you.
Picture: Fishbone Diagram Example
Related Solution:
Do you like infographics and data visualization? Creating infographics is super-easy with ConceptDraw.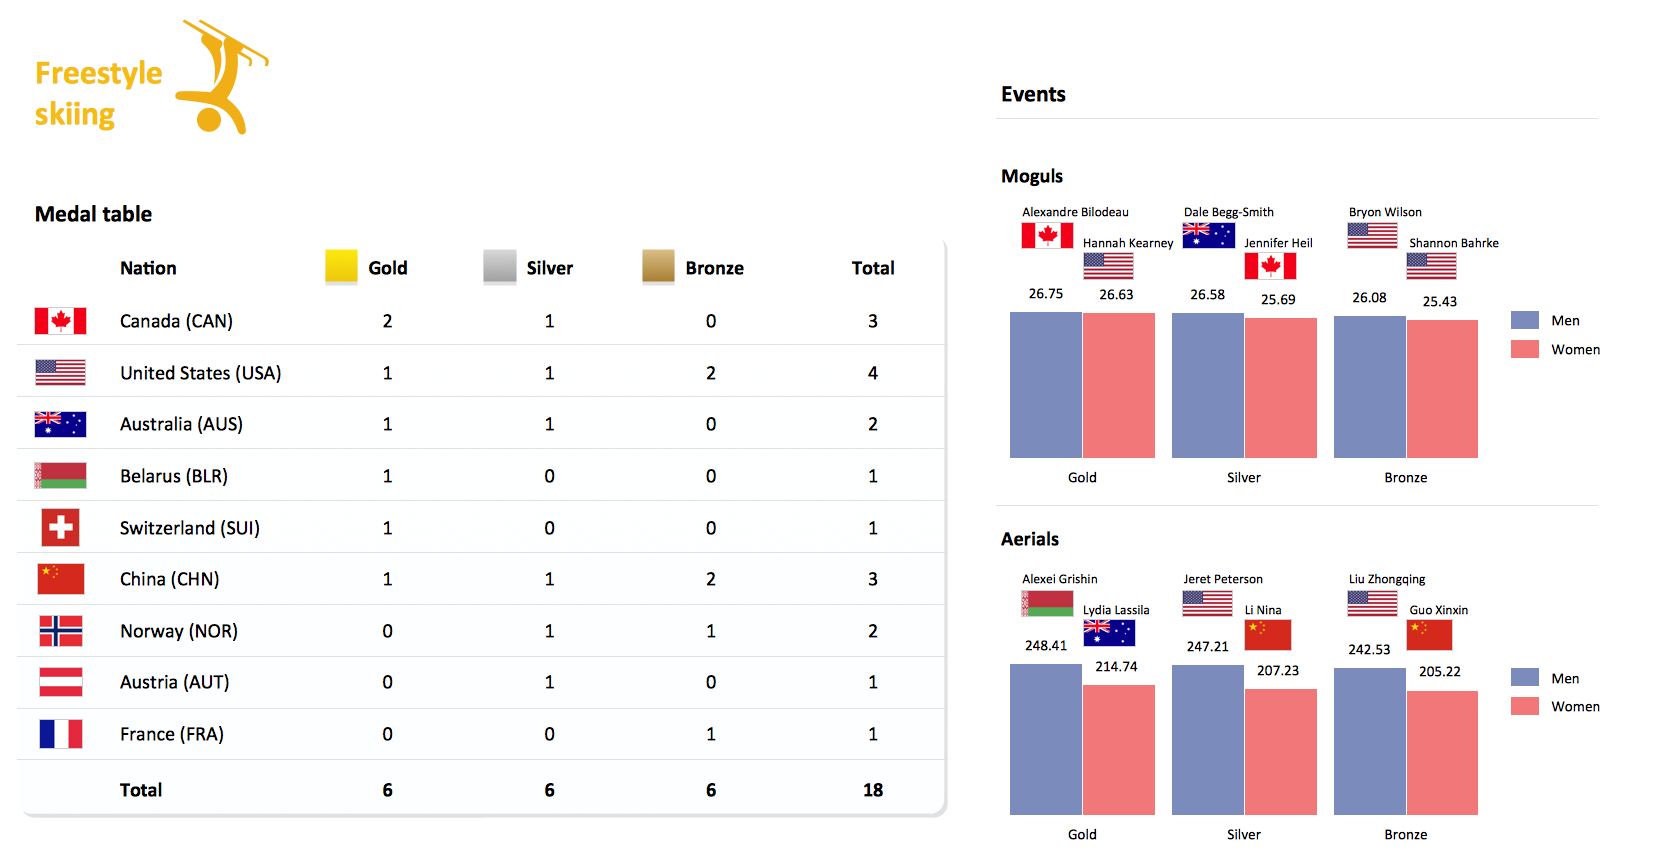
Picture: Winter Sports. Olympic Games Illustrations. Medal Summary
Related Solution:
ConceptDraw DIAGRAM diagramming and vector drawing software offers the Fault Tree Analysis Diagrams Solution from the Industrial Engineering Area of ConceptDraw Solution Park for quick and easy creating the Fault Tree Diagram of any degree of detailing.
Picture: Fault Tree Diagram
Related Solution:
The Total Quality Management Diagram solution helps your organization visualize business and industrial processes. Create Total Quality Management diagrams for business process with ConceptDraw software.
Picture: Management Tools — Total Quality Management
Related Solution:
Fishbone Diagram is another name for the Cause and Effect Diagram or the Ishikawa Diagram which got its name from the fact that it looks like a fish skeleton. Developed by Kaoru Ishikawa in 1968, a Fishbone Diagram is effectively used for a cause and effect analysis which allows to consider all possible causes for a certain problem or event.
ConceptDraw DIAGRAM supplied with Fishbone Diagrams solution from the Management area is the best software for fast and easy drawing professional looking Fishbone Diagram.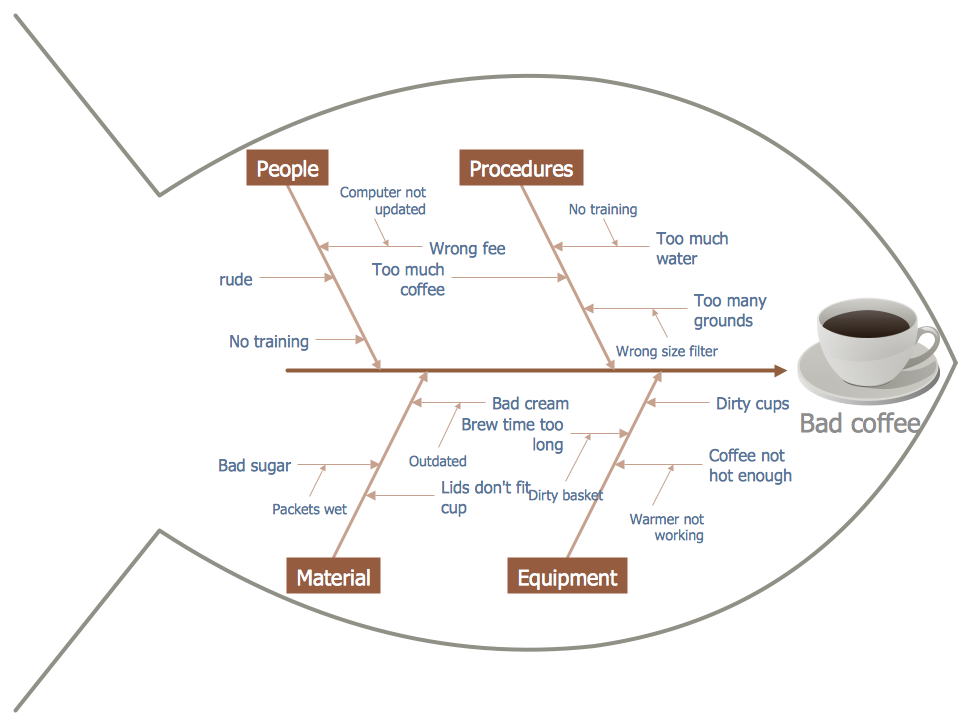
Picture: Fishbone Diagram
Related Solution:
This method of problem analysis is widely used in IT, manufacture industries and chemical engineering. If you want to take a fresh look on your problem, you can draw a fishbone diagram with ConceptDraw DIAGRAM software, which supports both MAC OS and Windows. You can see and download fishbone diagram samples and templates in ConceptDraw Solution Park.
This Fishbone (Ishikawa) diagram can be applied as template for performing the cause and effect analysis of a service industry problems. It can help to determine factors causing problems. Causes in this diagram are categorized according to the 4S’s principle that means Surroundings, Suppliers, Systems and Skills. Grouping causes allows to reveal main interactions between different events. This diagram was made using ConceptDraw Fishbone diagrams solution. It can help to reveal the causes effected a complicated issue. Of course it can be used together with other methods of approaching to the problem solving.
Picture: Draw Fishbone Diagram on MAC Software
Related Solution:
Cause and Effect Fishbone Diagram is one of the popular productivity and management tools widely used in business organizations. It is also known as Fishbone Diagram, because it looks like a fish skeleton. Cause and Effect Diagram provides a structured way which helps to identify all possible causes of a problem. Cause and Effect Diagram can be applied anywhere where exists a causal relationship.
Now the problem of complexity the Cause and Effect Fishbone Diagram creating is solved thanks to the ConceptDraw DIAGRAM diagramming and vector drawing software extended with Fishbone Diagrams solution from the Management area.
Picture: Cause and Effect Fishbone Diagram
Related Solution:
Create bar charts for business management problem solving and data comparison using the ConceptDraw DIAGRAM diagramming and vector drawing software extended with the Bar Graphs Solution from the Graphs and Charts area of ConceptDraw Solition Park.
Picture: Bar Diagrams for Problem Solving.Create business management bar charts with Bar Graphs Solution
Related Solution:
ConceptDraw gives the ability to draw simple diagrams like flowcharts, block diagrams, bar charts, histograms, pie charts, divided bar diagrams, line graphs, area charts, scatter plots, circular arrows diagrams, Venn diagrams, bubble diagrams, concept maps, and others.
Picture: Simple Drawing Applications for Mac
Related Solution:

