Ice Hockey Rink Diagram
All of the ice hockey players use the ice hockey rink for playing their favourite game on it. Ice hockey rink dimensions have to meet the general requirements of the ice hockey game rules, otherwise this game cannot be called professional and it cannot be played on a professional level. The game of ice hockey itself is a competing sport, which is very popular nowadays, especially among many Canadian people. The ice hockey rink is a rectangular with rounded corners. It is surrounded by a wall of 1 meter high and this wall is there to protect all of the ice hockey fans from getting injured by the ice hockey puck while watching the ice hockey game. This wall is called in the ice hockey as the “boards”.
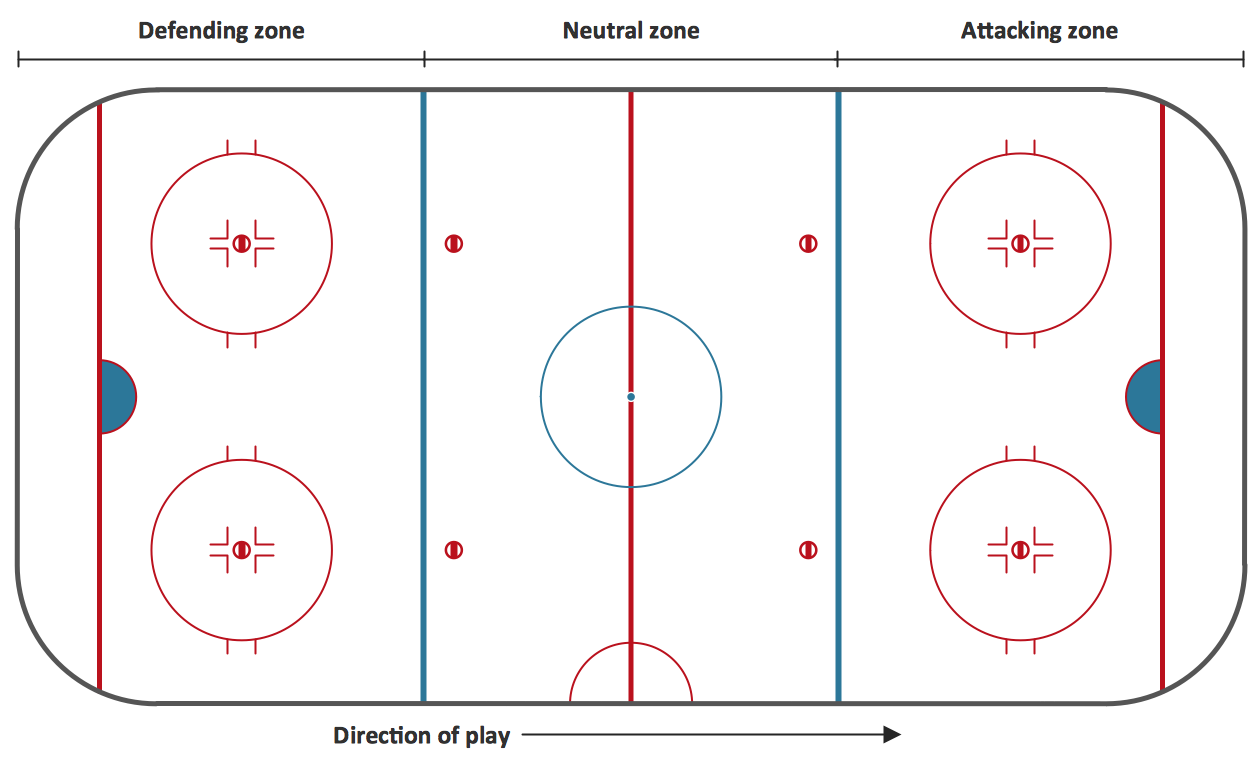
There are a couple of distinctions in the ice hockey rules about the ice hockey rink dimensions and other things. First ice hockey rink dimensions rules are known as “Olympic” and according to them the rink should be 30 metres in width and 61 metres in length with a corner radius of 8,5 metres. These ice hockey rinks dimensions are used for playing the international games. There are all together the 5 lines marked as “icing line”, “blue line”, “centre red line”, “blue line” and “icing line” on the surface of the ice hockey rink, followed by these rules. There are middle 3 lines marking the 3 zones of the rink and they are called the “defending zone” (which lies from icing line to blue line), the “neutral zone” (which lies from blue line to blue line) and the “attacking zone” (lying from blue line to the “icing” line). The blue lines are 22,86 metres from the end boards and the two “icing” lines are only four metres from the end boards.
Most of the North American rinks follow the specifications below: 61 metres by 26 metres with a corner radius of the same size as “Olympic” – 8,5 metres. The distance from the “end” boards to the nearest “goal line” should be 3,4 metres. The “centre line” is used for dividing the ice hockey rink in half and it is also used for judging the team players. So if a team sends the puck across the “centre” line (the red one), blue line and after across the goal line, then they call it “icing”. There are also 2 “blue” lines and they are meant to divide the ice hockey rink into three parts or, so called “zones”. These two lines are used for judging in case a player is offside. But if an attacking player crosses the line going into the other team's zone prior to the puck crossing, then this situation is called an “offside”.
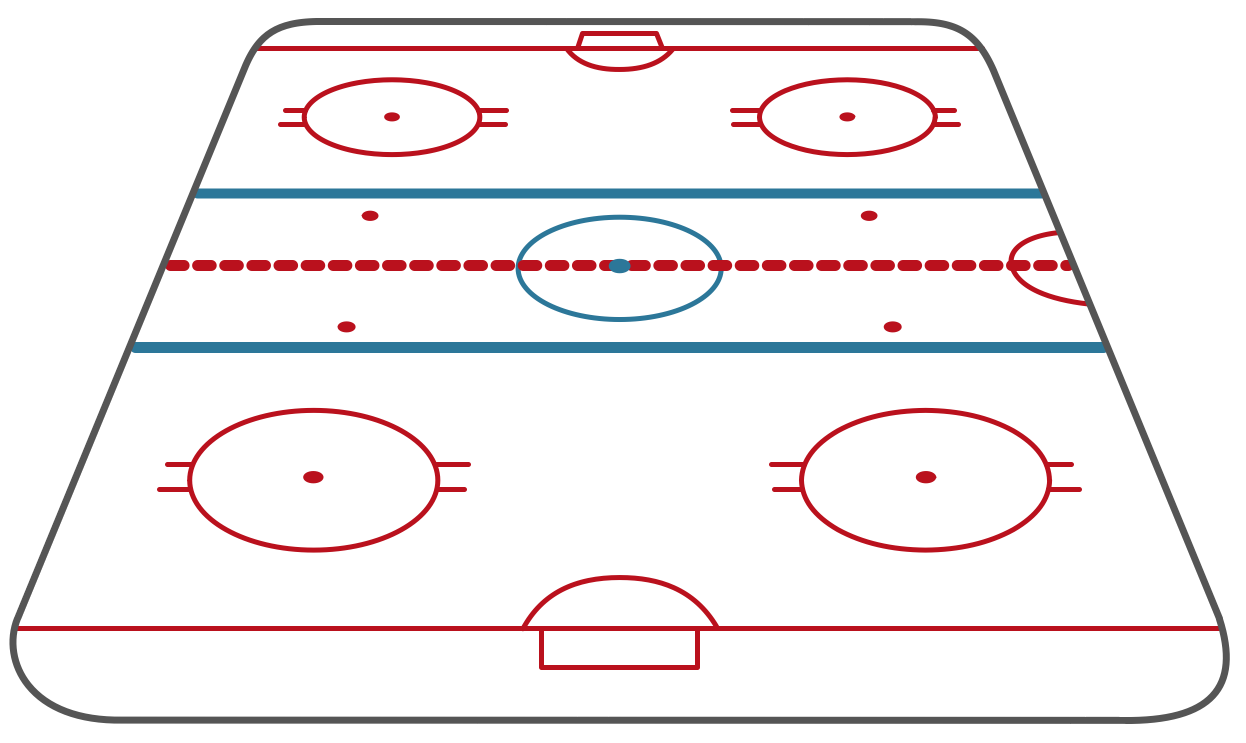
Near each of the ends of the rink there is a thin red so called “goal line”. This “goal line” is used for judging the goals and also the icing calls. There are also 9 “faceoff spots” on an ice hockey rink and all of them take place at these spots. There are two spots in each team's defensive zone, two at each of the ends of the neutral zone and only one in the centre of the rink. There are “faceoff circles” around the whole centre of the rink and there are “hash marks”, painted on the ice near the end zone faceoff spots. The circles and “hash marks” are there for showing where players can position themselves during a faceoff. Both the centre faceoff circle and the centre faceoff spot are marked in blue. The circle is all together nine metres in its diameter with one outline of 5 centimetres. The faceoff spot is usually marked in a solid blue circle of 30 centimetres in its diameter. All of the other circles and faceoff spots are coloured in red colour. Each of the spots consists of a circle, which is sixty centimetres in its diameter with an outline of 5 centimetres.
There are so many other rules about how to play this fin ice hockey game and about the ice hockey rink itself, including the strict rules about the ice hockey rink dimensions. If you want to draw a plan for ice hockey rink or an ice hockey rink diagram, then you have to take all of the mentioned rules into consideration as it is very important to know all of the exact dimensions. Knowing them for sure, you have this unique chance to create your own ice hockey rink plan, so it looks simply smart and professional, in case you use the right software for making your drawings, and one of the best existing applications for making such sport games fields plans, including the ice hockey rinks drawings, is nowadays a ConceptDraw DIAGRAM one. This application allows to make your own good looking drawings, so they look professional and smart. Having all of the necessary tools in order to create something special, you will find ConceptDraw DIAGRAM to be a very helpful tool.
With the help of ConceptDraw DIAGRAM you can always concentrate on the problem you face and which has to be solved, but not on the details, such as the correct dimensions, as using the provided examples from the solutions available for all of the ConceptDraw DIAGRAM users, you can simply concentrate on the process of creating the sport field plan itself, not on making the design elements for being able to draw it. There are so many pre-made design objects as well as all of the other useful tools, such as samples and templates, not only design elements, which are all can be found in the appropriate stencil libraries in the solutions you choose. These solutions, which were developed by the ConceptDraw DIAGRAM team of IT professionals as well as web designers, you can find both whether on this site or in ConceptDraw STORE application. ConceptDraw STORE is another product of CS Odessa, developed for the purpose of supporting ConceptDraw DIAGRAM users in their drawings by providing the tools for making the process of drawing entertaining and fun.
Downloading “Ice Hockey” solution from this site or from the application ConceptDraw STORE (which you can always download from this site) will enable you to use any of the previously created examples for making your own smart and professionally looking Ice Hockey Diagram. You will find 2 libraries available for all of the ConceptDraw DIAGRAM users: "Ice Hockey Positions" and "Ice Hockey Rinks" ones. These libraries will allow you to create an ice-hockey-related drawing such as ice hockey rink diagram, in only couple of minutes using ConceptDraw DIAGRAM application.

The main advantage of using ConceptDraw Ice Hockey Solution is that you don't need to draw objects manually, you have all you need in libraries, templates and samples. This allows you produce professional ice hockey diagrams as quickly as possible, and then post them to blog or social media, print or present on a large screen.
The diagrams you see on this page was created in ConceptDraw DIAGRAM specially for Ice Hockey Solution.
All source documents are vector graphic documents. They are available for reviewing, modifying, or converting to a variety of formats (PDF file, MS PowerPoint, MS Visio, and many other graphic formats) from the ConceptDraw STORE.

The Ice Hockey Solution is available for all ConceptDraw DIAGRAM or later users.