Ice Hockey Diagram – Penalty Kill Forecheck Angling Drill
"A penalty in ice hockey is a punishment for an infringement of the rules. Most penalties are enforced by detaining the offending player within a penalty box for a set number of minutes, during which the player can not participate in play. Penalties are called and enforced by the referee, or in some cases the linesmen. The offending team usually may not replace the player on the ice, leaving them short handed as opposed to full strength. The opposing team is said to be on a power play, having one player more on the ice than the short-handed team. The short handed team is said to be "penalty killing" until the penalty expires and the penalized player returns to play. While standards vary somewhat between leagues, most leagues recognize several common degrees of penalty, as well as common infractions." [Wikipedia]
ConceptDraw Ice Hockey solution is a good tool to think about complex things. You don't need a software during hockey match, of course. Drawing software helps to plan strategy and tactics before a match, and then analyze mistakes and results.
A combination of the "Ice Hockey Rinks" and "Ice Hockey Positions" libraries gives you an ability to create a ice-hockey-related drawing in seconds. Follow next steps to create you own ice hockey schema:
- From the "Ice Hockey Rinks" library drop a rink object to your document
- From the "Ice Hockey Positions" library drop all positions object you need to your document
- Place positions on the rink according to your drawing idea
- Add arrows or text labels if needed.

Sample 1. Ice Hockey Diagram – Penalty Kill Forecheck Angling Drill.
This diagram was created in ConceptDraw DIAGRAM using the "Ice Hockey Rinks" library from the Ice Hockey solution. An experienced user spent 1 minute creating this sample.
The sample you see on this page was created in ConceptDraw DIAGRAM using the Ice Hockey Solution; it demonstrates a portion of the solution's capabilities and the professional results you can achieve.
All source documents are vector graphic documents. They are available for reviewing, modifying, or converting to a variety of formats (PDF file, MS PowerPoint, MS Visio, and many other graphic formats) from the ConceptDraw STORE. The Ice Hockey Solution is available for all ConceptDraw DIAGRAM or later users.
TEN RELATED HOW TO's:
Data flow diagrams are the graphical tool, used in the visualization of data flow of some data processing systems. It is the valuable process modeling tool. Also designing DFD is the important component of the initial part of any information system development project. The standard symbols are used to represent the interaction of a system components and how various kinds of components influence on data flow. The ConceptDraw Data Flow Diagrams solution is design to assist professional software engineers in making DFDs according to Gane and Sarson, and Yourdon and Coad notations.
Do you imagine yourself as a successful IT specialist? To your mind, they all use data flow diagram examples to learn and to get inspired. Aren’t you still with us?
Picture: Data Flow Diagram Examples
Related Solution:
Using diagrams is the easiest way to explain American Football defensive formations. The Football solution for ConceptDraw DIAGRAM contains a set of samples depicts the most popular defensive formations diagrams. Using embedded presentation tools you are able to share your football knowledge with wide audience.
Picture: Defensive Formation – 4-3 Defense Diagram
Related Solution:
ConceptDraw Ice Hockey Solution for ConceptDraw DIAGRAM delivers the "Ice Hockey Positions" library that contains predesigned objects for all ice hockey positions. A set of templates and samples demonstrates best practice of using this library.
Picture: Ice Hockey Positions Diagram
Related Solution:
Outdoor activities are a very important part of leisure. Although standard basketball court dimensions are strict, you can do something to set a court even in your yard. With ConceptDraw DIAGRAM you can develop a plan to see how a basketball court is going to fit in your yard.
The favorite method of basketball coaches is visualization. For learning, for disassembly of played matches or for planning the strategy of the coming games - they always use a picture of basketball courts. Such schematically picture should have scale and should depict precisely standard equipment and dimensions of the basketball court. The Basketball solution for ConceptDraw DIAGRAM was developed as a tool for drawing different basketball schemes and illustrations.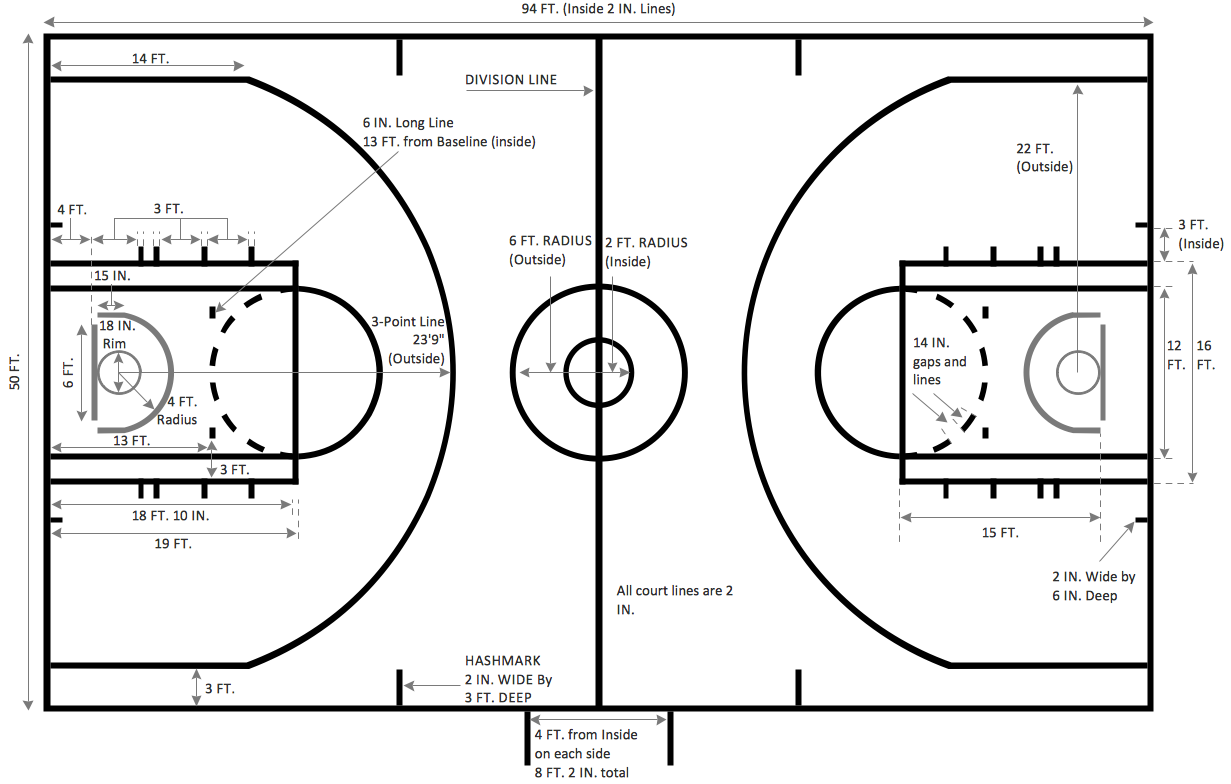
Picture: Basketball Court Dimensions
Related Solution:
The main advantage of using ConceptDraw Ice Hockey Solution is that you don't need to draw objects manually, you have all you need in libraries, templates and samples. This allows you produce professional ice hockey diagrams as quickly as possible, and then post them to blog or social media, print or present on a large screen.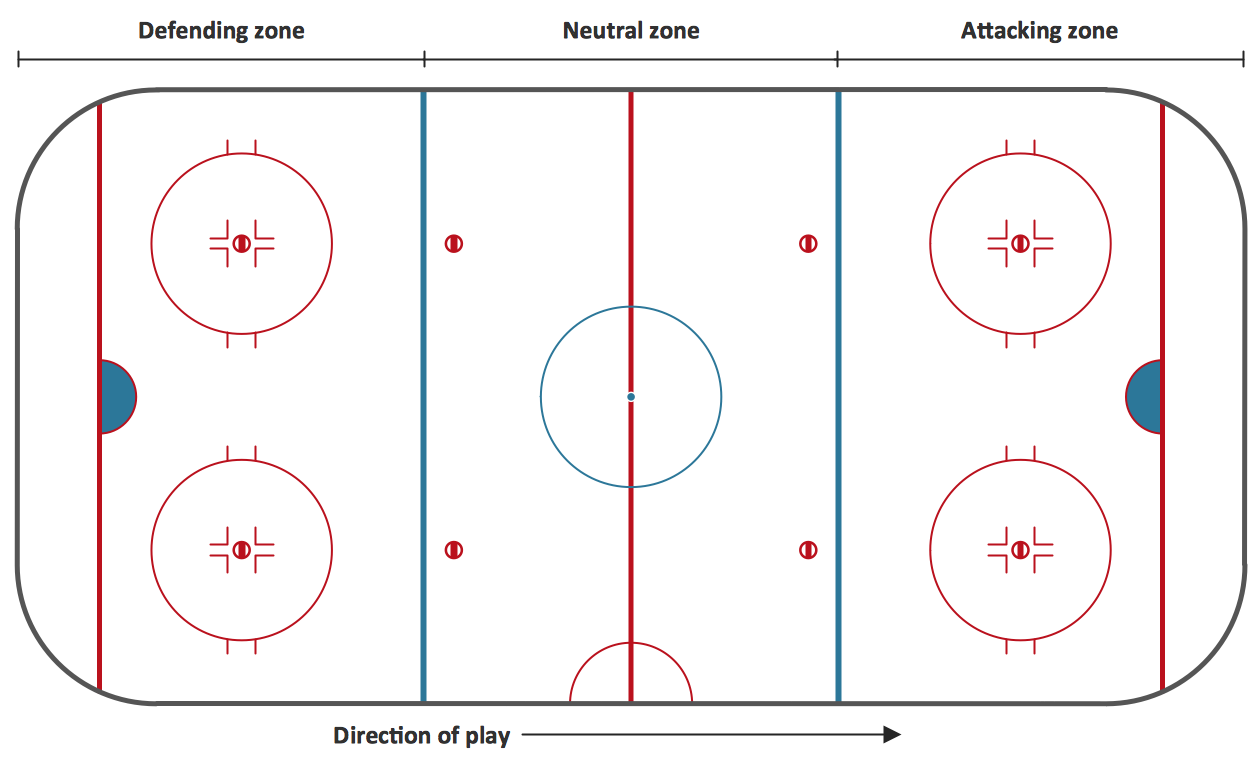
Picture: Ice Hockey Rink Diagram
Related Solution:
Explaining ice hockey techniques becomes much more easier and time saving with illustrations. The Ice Hockey solution for ConceptDraw DIAGRAM is designed as a tool that helps produce ice hockey illustrations of any complexity in minutes.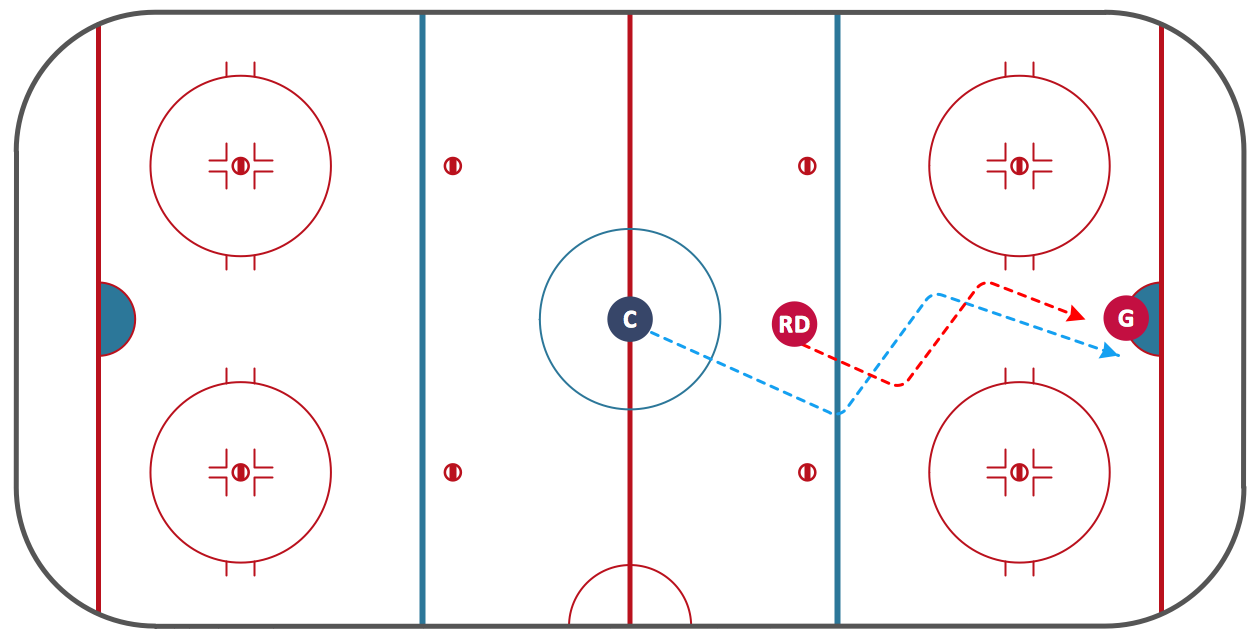
Picture: Ice Hockey Diagram – Deke Technique
Related Solution:
Explaining the soccer techniques and rules becomes much more easier and time saving with illustrations. The Soccer solution from the Sport area of ConceptDraw Solution Park provides the libraries, templates and samples that will help you produce the soccer illustrations of any complexity in minutes.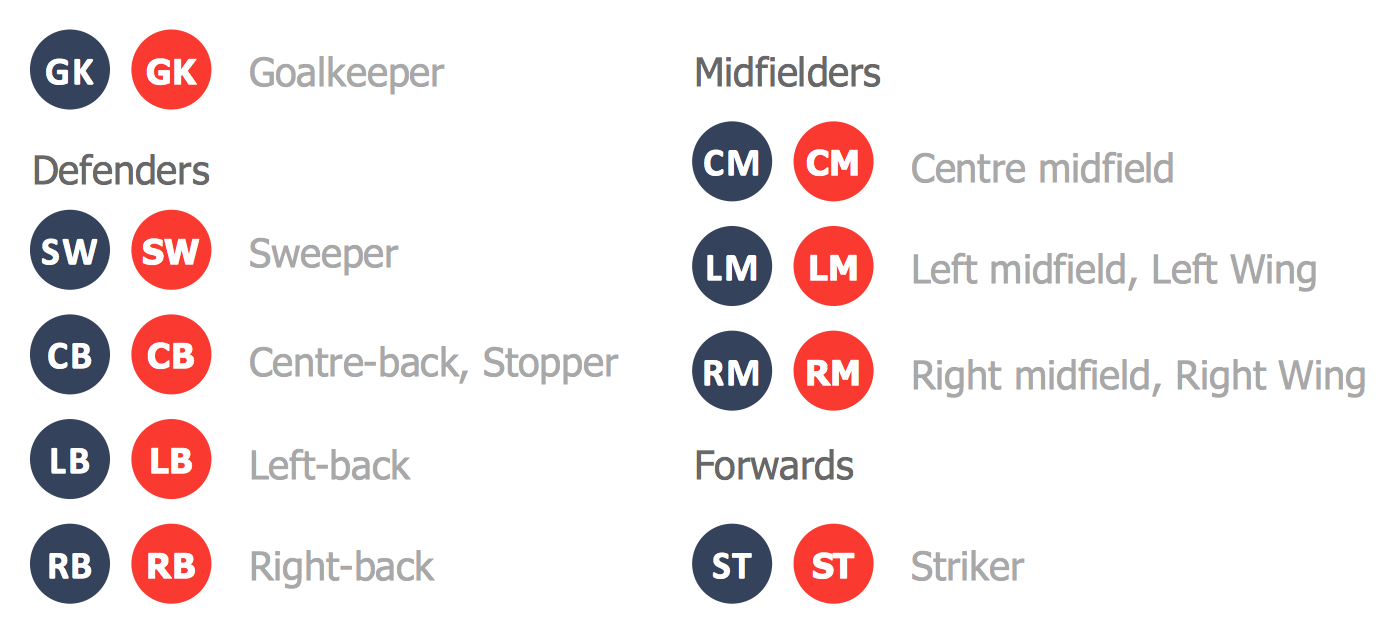
Picture: Create Soccer (Football) Positions
Related Solution:
Using diagrams is the easiest way to explain the soccer formations. The Soccer solution from the Sport area of ConceptDraw Solution Park is designed as a tool that helps you produce the soccer diagrams in a few minutes. The predesigned samples of the Soccer solution for ConceptDraw DIAGRAM depict the most popular formation diagrams.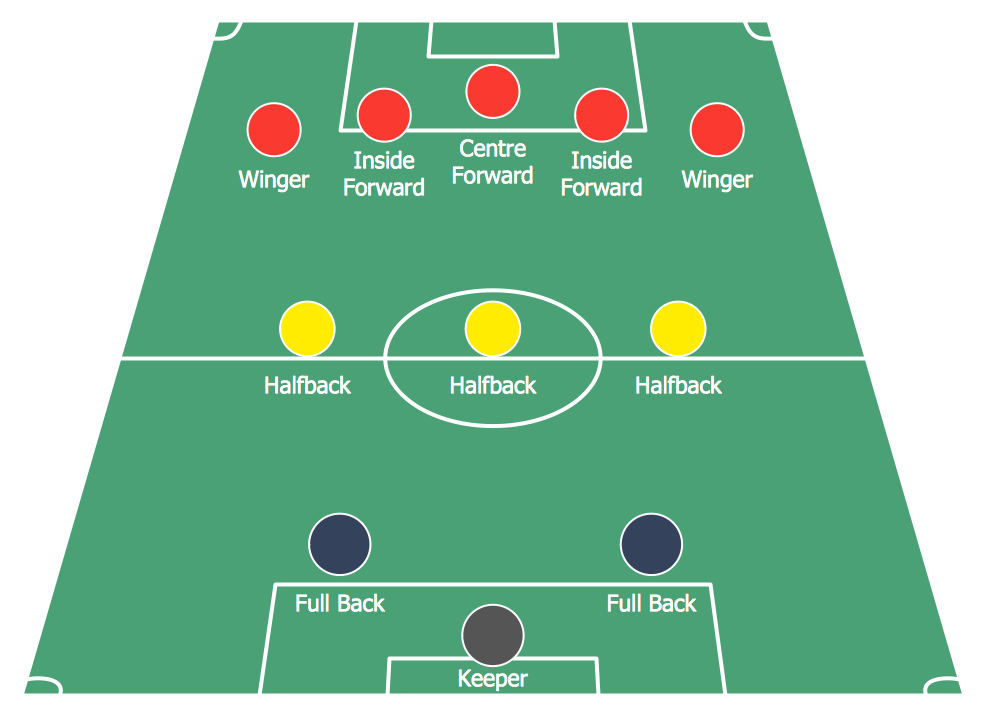
Picture: Soccer (Football) Formation
Related Solution:
The Basketball Field library from the Basketball solution provides a complete set of ready-to-use predesigned vector courts: horizontally and vertically located, whole and half of court, colored and not, courts with views from different sides.
All courts objects are designed according to the real basketball courts dimensions. Simply drop the needed basketball field in the vector from the library to design your own basketball diagram.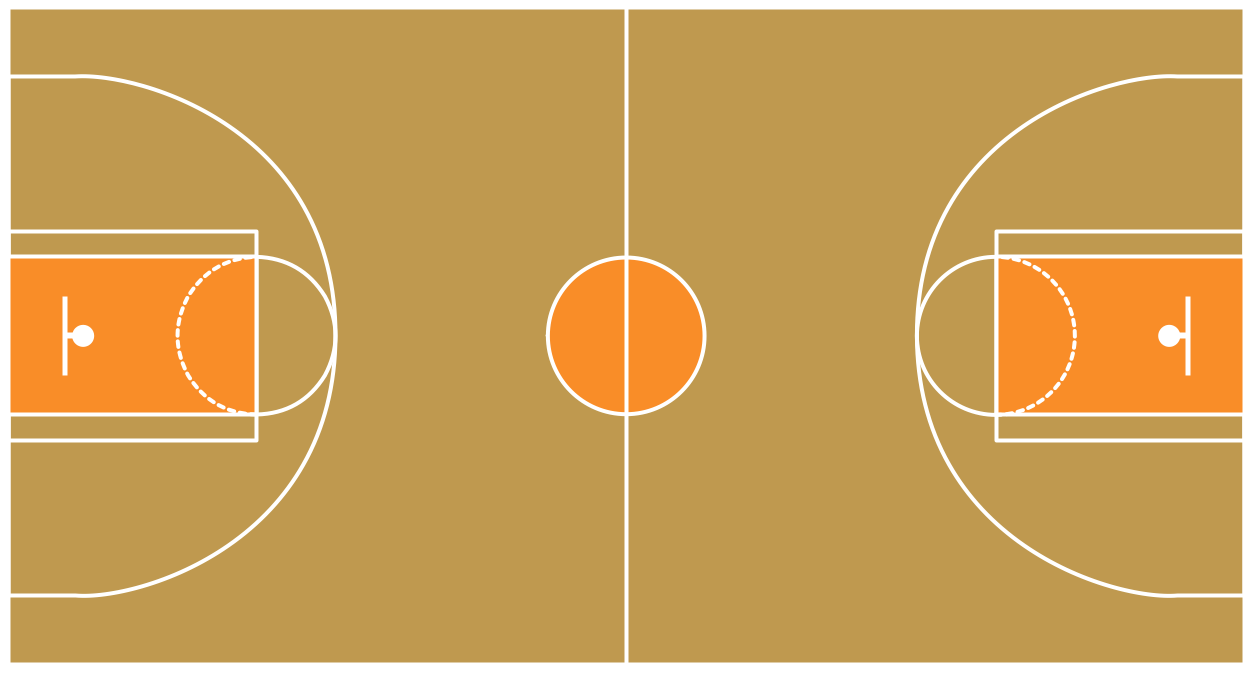
Picture: Basketball Field in the Vector
Related Solution:
There are many ways to define the flow of information within a system. Structured-systems analysis method often uses data flow diagrams to show data flow, data storages and data processing visualization. These diagrams are easy to develop and quite useful.
Here is a dataflow diagram presenting an example of the manufacturing process flow. The oval process shapes represent a process that controls data within the current system. The process may produce data or make some action based on data. Data flows are represented by lines. They show the movement of information through the system. The direction of the data flow is depicted by the arrow. The external entities are shown by rectangles. They represent the external entities interacting with the system. The data store objects (unclosed rectangles) are used to show data bases participating in a process flow.
Picture: Data Flow Diagram
Related Solution: