Horizontal Org Flow Chart
Horizontal Org Flow Chart is a diagram that helps you to show the structure of an organization, different levels of management, hierarchy, and relationships of organization parts or positions in terms of authority and responsibility. Orgcharts are perfect to be used for providing a “snapshot” picture of the reporting relationships, divisions of work, and levels of management both to employees and individuals outside of the organization.
The construction of an Org Flow Chart in a horizontal view is incredibly convenient in many cases. A lot of organizations introduce the horizontal organizational model in their work. Typically, these are the organizations without middle management level, only a top manager and employees directly subordinated him. Moreover, it is an employee-centered approach and this has a great impact on the way of solving important issues, collaboration, and communication.
A horizontal organizational structure is used by the companies with a quite flexible approach to work, where the employees play a dominant role, have freedom of actions while operating in the company's interests. The independent daily decision-making by employees and communication with management only in the most important and responsible issues is involved.
As a rule, a horizontal organizational structure has a few layers, but there are a lot of exceptions and ConceptDraw DIAGRAM software allows designing charts depicting both simple and complicated hierarchies, as well as viewing the entire chart at once using customizable zoom settings.
The use of common flowchart notation elements is the aptly way to depict graphically the business processes, to present visually the way the processes work in a company's organizational structure to depict their complexity, to identify possible failures and to develop the ways to improve the company's work.

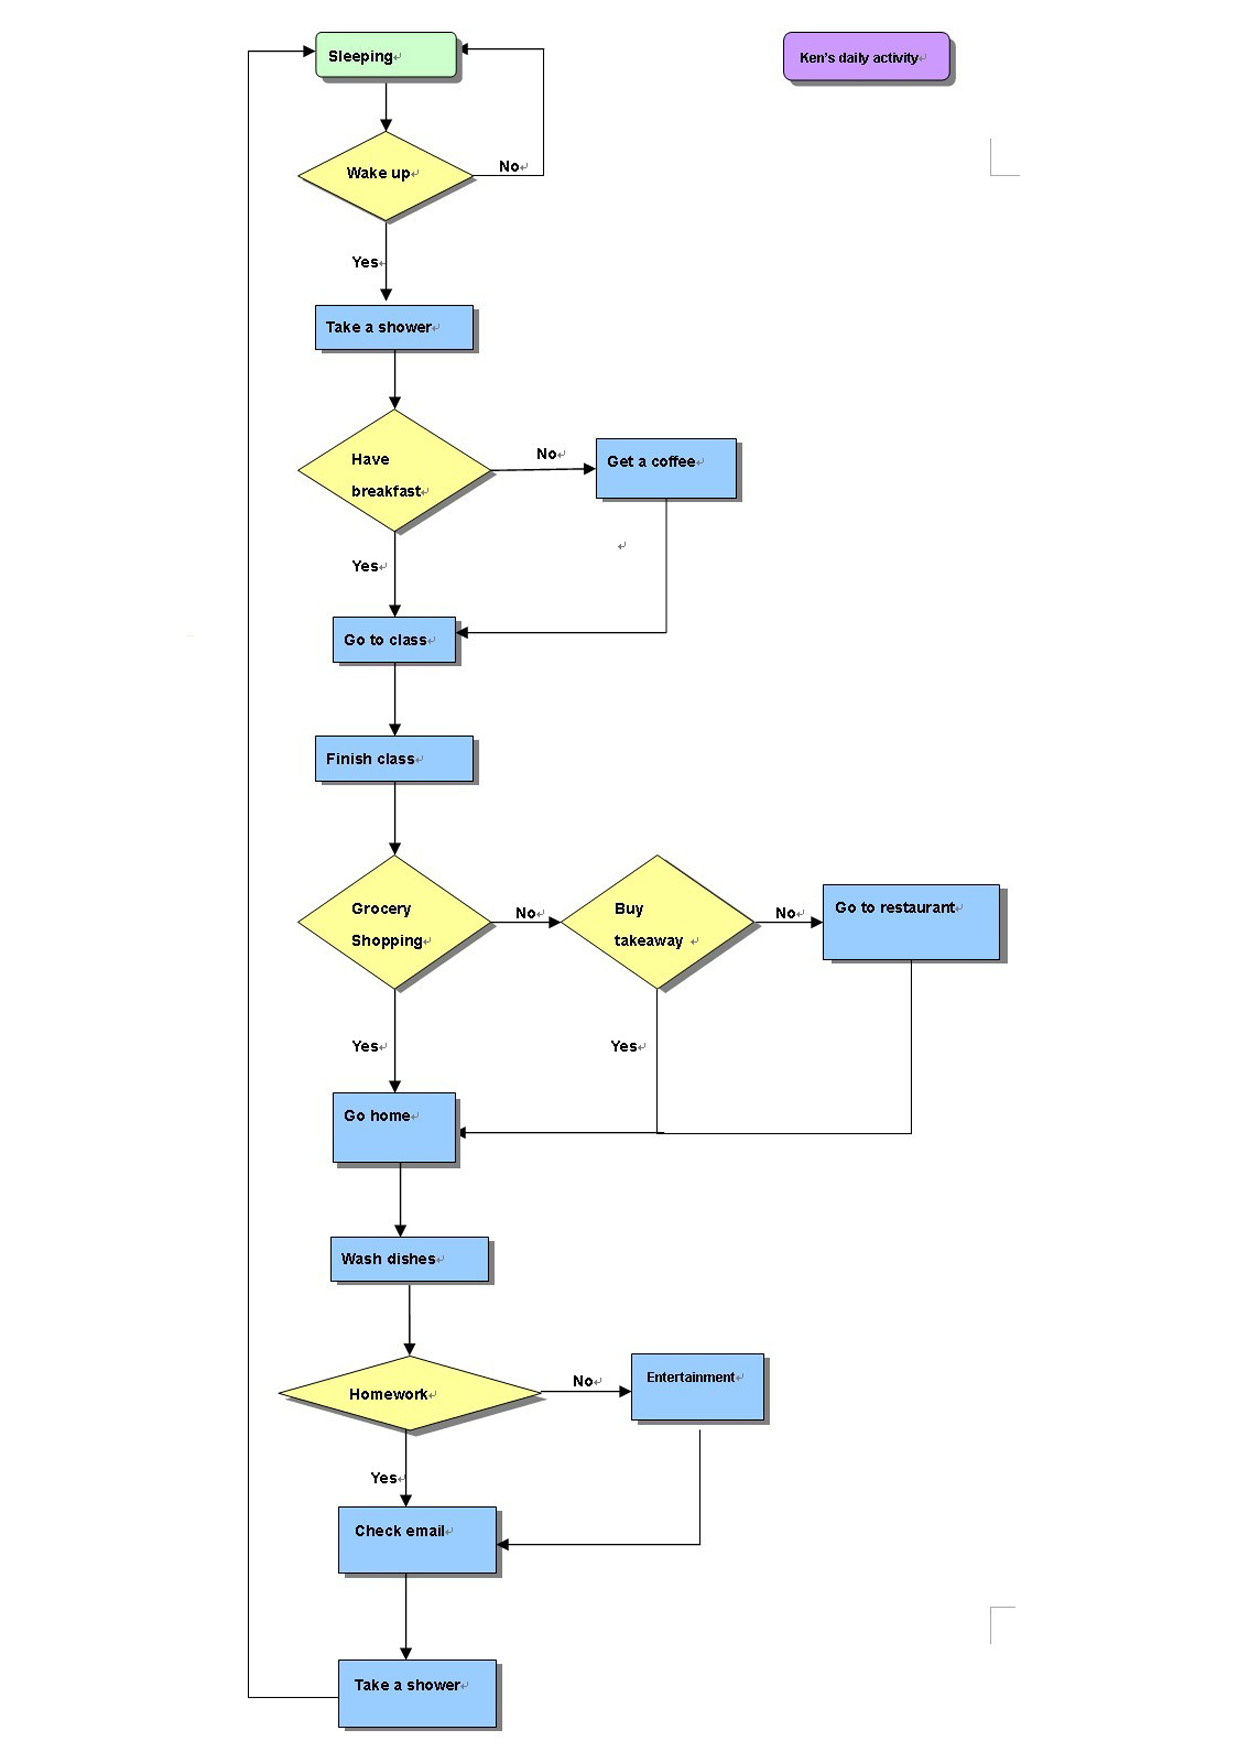
Example 1. Horizontal Org Flow Chart
This example was redesigned from the file [openobject.org]
This sample was created in ConceptDraw DIAGRAM charting and vector drawing software using the Organizational Charts solution from the Management area and Flowcharts solution from the Diagrams area of ConceptDraw Solution Park. It shows the Horizontal Organizational Flow Chart. The special objects from the solutions' libraries were used in this diagram and represent the sequence of the steps or actions in the flow process and the relationships between them.
Use the predesigned objects, templates and samples of the Organizational Charts and Flowcharts solutions for ConceptDraw DIAGRAM to create your own professional Organizational flow charts and diagrams quick and easy.
All the diagrams produced with ConceptDraw DIAGRAM are vector graphic documents and are available for reviewing, modifying, and converting to a variety of formats (image, HTML, PDF file, MS PowerPoint Presentation, Adobe Flash or MS Visio).
See also Samples:
NINE RELATED HOW TO's:
When studying a business process or system involving the transfer of data, it is common to use a Data Flow Diagram (DFD) to visualize how data are processed. Being initially used exclusively in regards to the flow of data through a computer system, now DFDs are employed as the business modeling tools. They are applied to describe the business events and interactions, or physical systems involving data storage and transfer. ConceptDraw DIAGRAM is a powerful Data Flow Diagram software thanks to the Data Flow Diagrams solution from the Software Development area of ConceptDraw Solution Park.
Picture: Data Flow Diagram Software
Related Solution:
ConceptDraw DIAGRAM - business process modeling software for mac offers the Business Process Diagram Solution with powerful tools to help you easy represent the business processes and create the business process diagrams based on BPMN 1.2 and BPMN 2.0 standards that allows to create of both simple and complex (nested) models of processes.
There are 16 BPMN 1.2 and BPMN 2.0 stencil libraries containing 230 vector objects: Rapid Draw library, Connections library, Gateways and Artifacts libraries, Data library, Gateways library, Choreographies library, Conversations library, Activities libraries, Events libraries, Expanded Objects libraries, Swim lanes libraries.
Picture: Business Process Modeling Software for Mac
Related Solution:
PERT Chart Software - Activity Network and Project Evaluation and Review Technique, or PERT, charts are a way of documenting and analyzing the tasks in a project.
ConceptDraw DIAGRAM is a powerful diagramming and vector drawing software for designing professional looking PERT Charts quick and easy.
Picture: PERT Chart Software
Related Solution:

Picture: Percentage Spider Chart
Related Solution:
As restaurant industry is growing rapidly nowadays, researches show that almost half of the adults have worked in a restaurant or a cafe. Moreover, many of them dream to start their own someday. Unfortunately, it takes a lot of time to write a business plan and to find a great location, although some know how to create a restaurant floor plan in minutes or how to plan budget effortlessly. Hiring employees can also cause a lot of headache, but this is crucial for further success, because every guest comes to restaurant for a good service and delicious food. It is also worth noting that restaurant concept is also important, because it defines target audience and influences the menu.
This diagram represents the floor plan of an ongoing sports-theme establishment - restaurant, cafe, or other food service. A number of widescreen monitors installed along the perimeter provide visitors the opportunity to follow the course of a match from anywhere in the dining room of restaurant or cafe. The most of sports fans believe that food and alcohol is a big part of any sports show. That is why the dining room takes the most space - almost 60% of the total establishment space. Nearly all sports fans consume beverages while watching sports - beer, soda or water at least. Thus, the restaurant floor plan designers added a large lavatory there. Moreover, project developers considered unnecessary the gender division of such delicate place - perhaps they guess that only men are watching football, or believe that alcohol will eliminate the most of gender differences.
Picture: How To Create Restaurant Floor Plan in Minutes
Related Solution:
Interactive tool helps you find the appropriate response to social media mentions quickly.
Picture: How to Use the ″Online Store PR Campaign″ Sample
Related Solution:
This sample shows the Flowchart of the testing the work of the lamp and decision making about what to do to lamp will work.
Picture: Samples of Flowchart
Related Solution:
Functional modeling allows to make complex business processes simple. One of the basic methods is IDEF0 and one of the most effective also. To create a business model, use flowchart symbols.
The IDEF0 library, supplied with ConceptDraw IDEF0 Diagrams solution contains 18 IDEF0 basic notation symbols. All symbols are the vector graphic images what means, that one can customize their size preserving the stable quality. Another library of IDEF0 symbols can be find out in the the Business Process Diagrams solution, included to the Business Processes section of ConceptDraw Solution Park. These libraries composed from just vector objects and are totally compatible. You can apply the IDEF0 symbols from both libraries at your flowcharts, if needed.
Picture: IDEF0 Flowchart Symbols
Related Solution:
This sample was created in ConceptDraw DIAGRAM diagramming and vector drawing software using the Pie Charts Solution from Graphs and Charts area of ConceptDraw Solution Park.
This sample shows the Pie Chart of the approximate air composition. You can see the percentage of oxygen, nitrogen and other gases in the air visualized on this Pie Chart.
Picture: Percentage Pie Chart. Pie Chart Examples
Related Solution: