Healthy Food Recipes
A healthy lifestyle and a balanced healthy diet are the basis of health, longevity and good feeling. Every day a human must receive with a food the correct proportions of nutrients and vitamins. It is very important to make a proper menu that includes tasty and healthy dishes.
ConceptDraw DIAGRAM diagramming and vector drawing software enhanced with Health Food solution from the Food and Beverage area of ConceptDraw Solution Park will help you easy develop, depict and appetizingly illustrate your healthy food recipes.
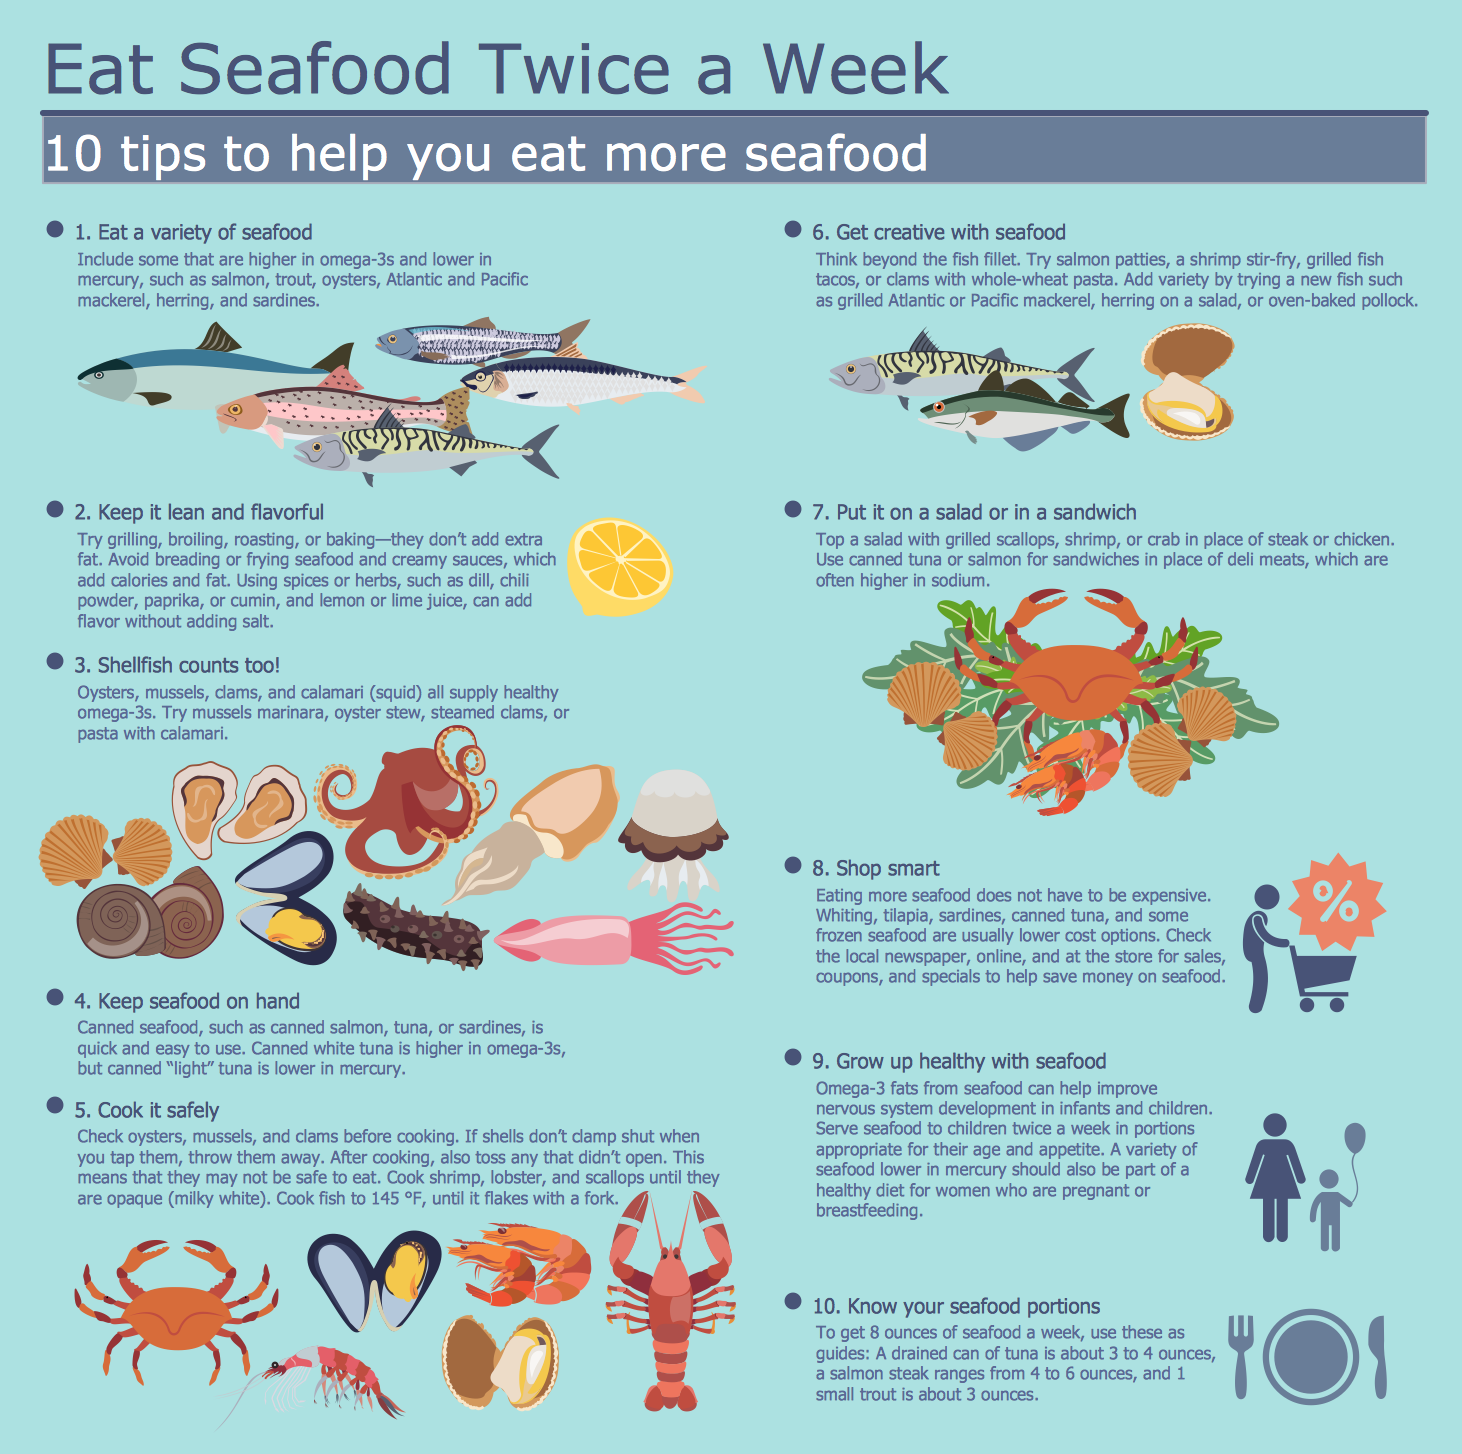
Example 1. Healthy Food Recipes - Eat More Seafood
Health Food Solution for ConceptDraw DIAGRAM is ideal for designing and illustration healthy food recipes! It includes incredibly large variety of colorful and easy-to-use vector objects and clipart grouped in 8 libraries.
You can click to enlarge and consider all 238 vector objects of healthy foods included to the Health Food Solution. Look at them - they are beautiful and colorful, and perfectly suit for illustration healthy food recipes.

Example 2. Healthy Food Recipes - A Cup in Dairy Group
The samples you see on this page were created in ConceptDraw DIAGRAM software using the Health Food Solution. These healthy foods illustrations successfully demonstrate solution's capabilities and professional results you can achieve. An experienced user spent 10-15 minutes creating each of them.
Use the Health Food Solution for ConceptDraw DIAGRAM Solution Park for drawing your own illustrations for healthy food recipes quick, easy and effective.
All source documents are vector graphic documents. They are available for reviewing, modifying, or converting to a variety of formats (PDF file, MS PowerPoint, MS Visio, and many other graphic formats) from the ConceptDraw STORE. The Health Food Solution is available for all ConceptDraw DIAGRAM users.
NINE RELATED HOW TO's:
Visual information is easier to perceive. You can teach even a child to make diagrams with a good flowchart example that would be interesting for it. Flowcharts can be fun, it’s not about business processes or programming algorithms.
This flowchart shows step by step process of manufacturing of Nixtamal The product which is obtained by processing maize with calcium hydroxide. We must assume that the Aztecs were very fond of this product, if the recipe of its production came to our times. This flow chart was designed using ConceptDraw DIAGRAM with its solution for designing flowcharts of various types, sizes and purposes. ConceptDraw Flowcharts solution consists from the library of flowchart symbols, containing the set vector objects. Also there are a lot of diverse templates and samples of flow charts.
Picture: Flowchart Examples and Templates
Related Solution:
You want to decorate menu, design pictorial illustration for the cooking article in the fashionable magazine, create attractive posters for your cafe or restaurant, or develop beautiful advertising materials? In order to ideally cope with all these tasks, use the easy recipes design software - ConceptDraw DIAGRAM extended with Cooking Recipes solution from the Food and Beverage area of ConceptDraw Solution Park.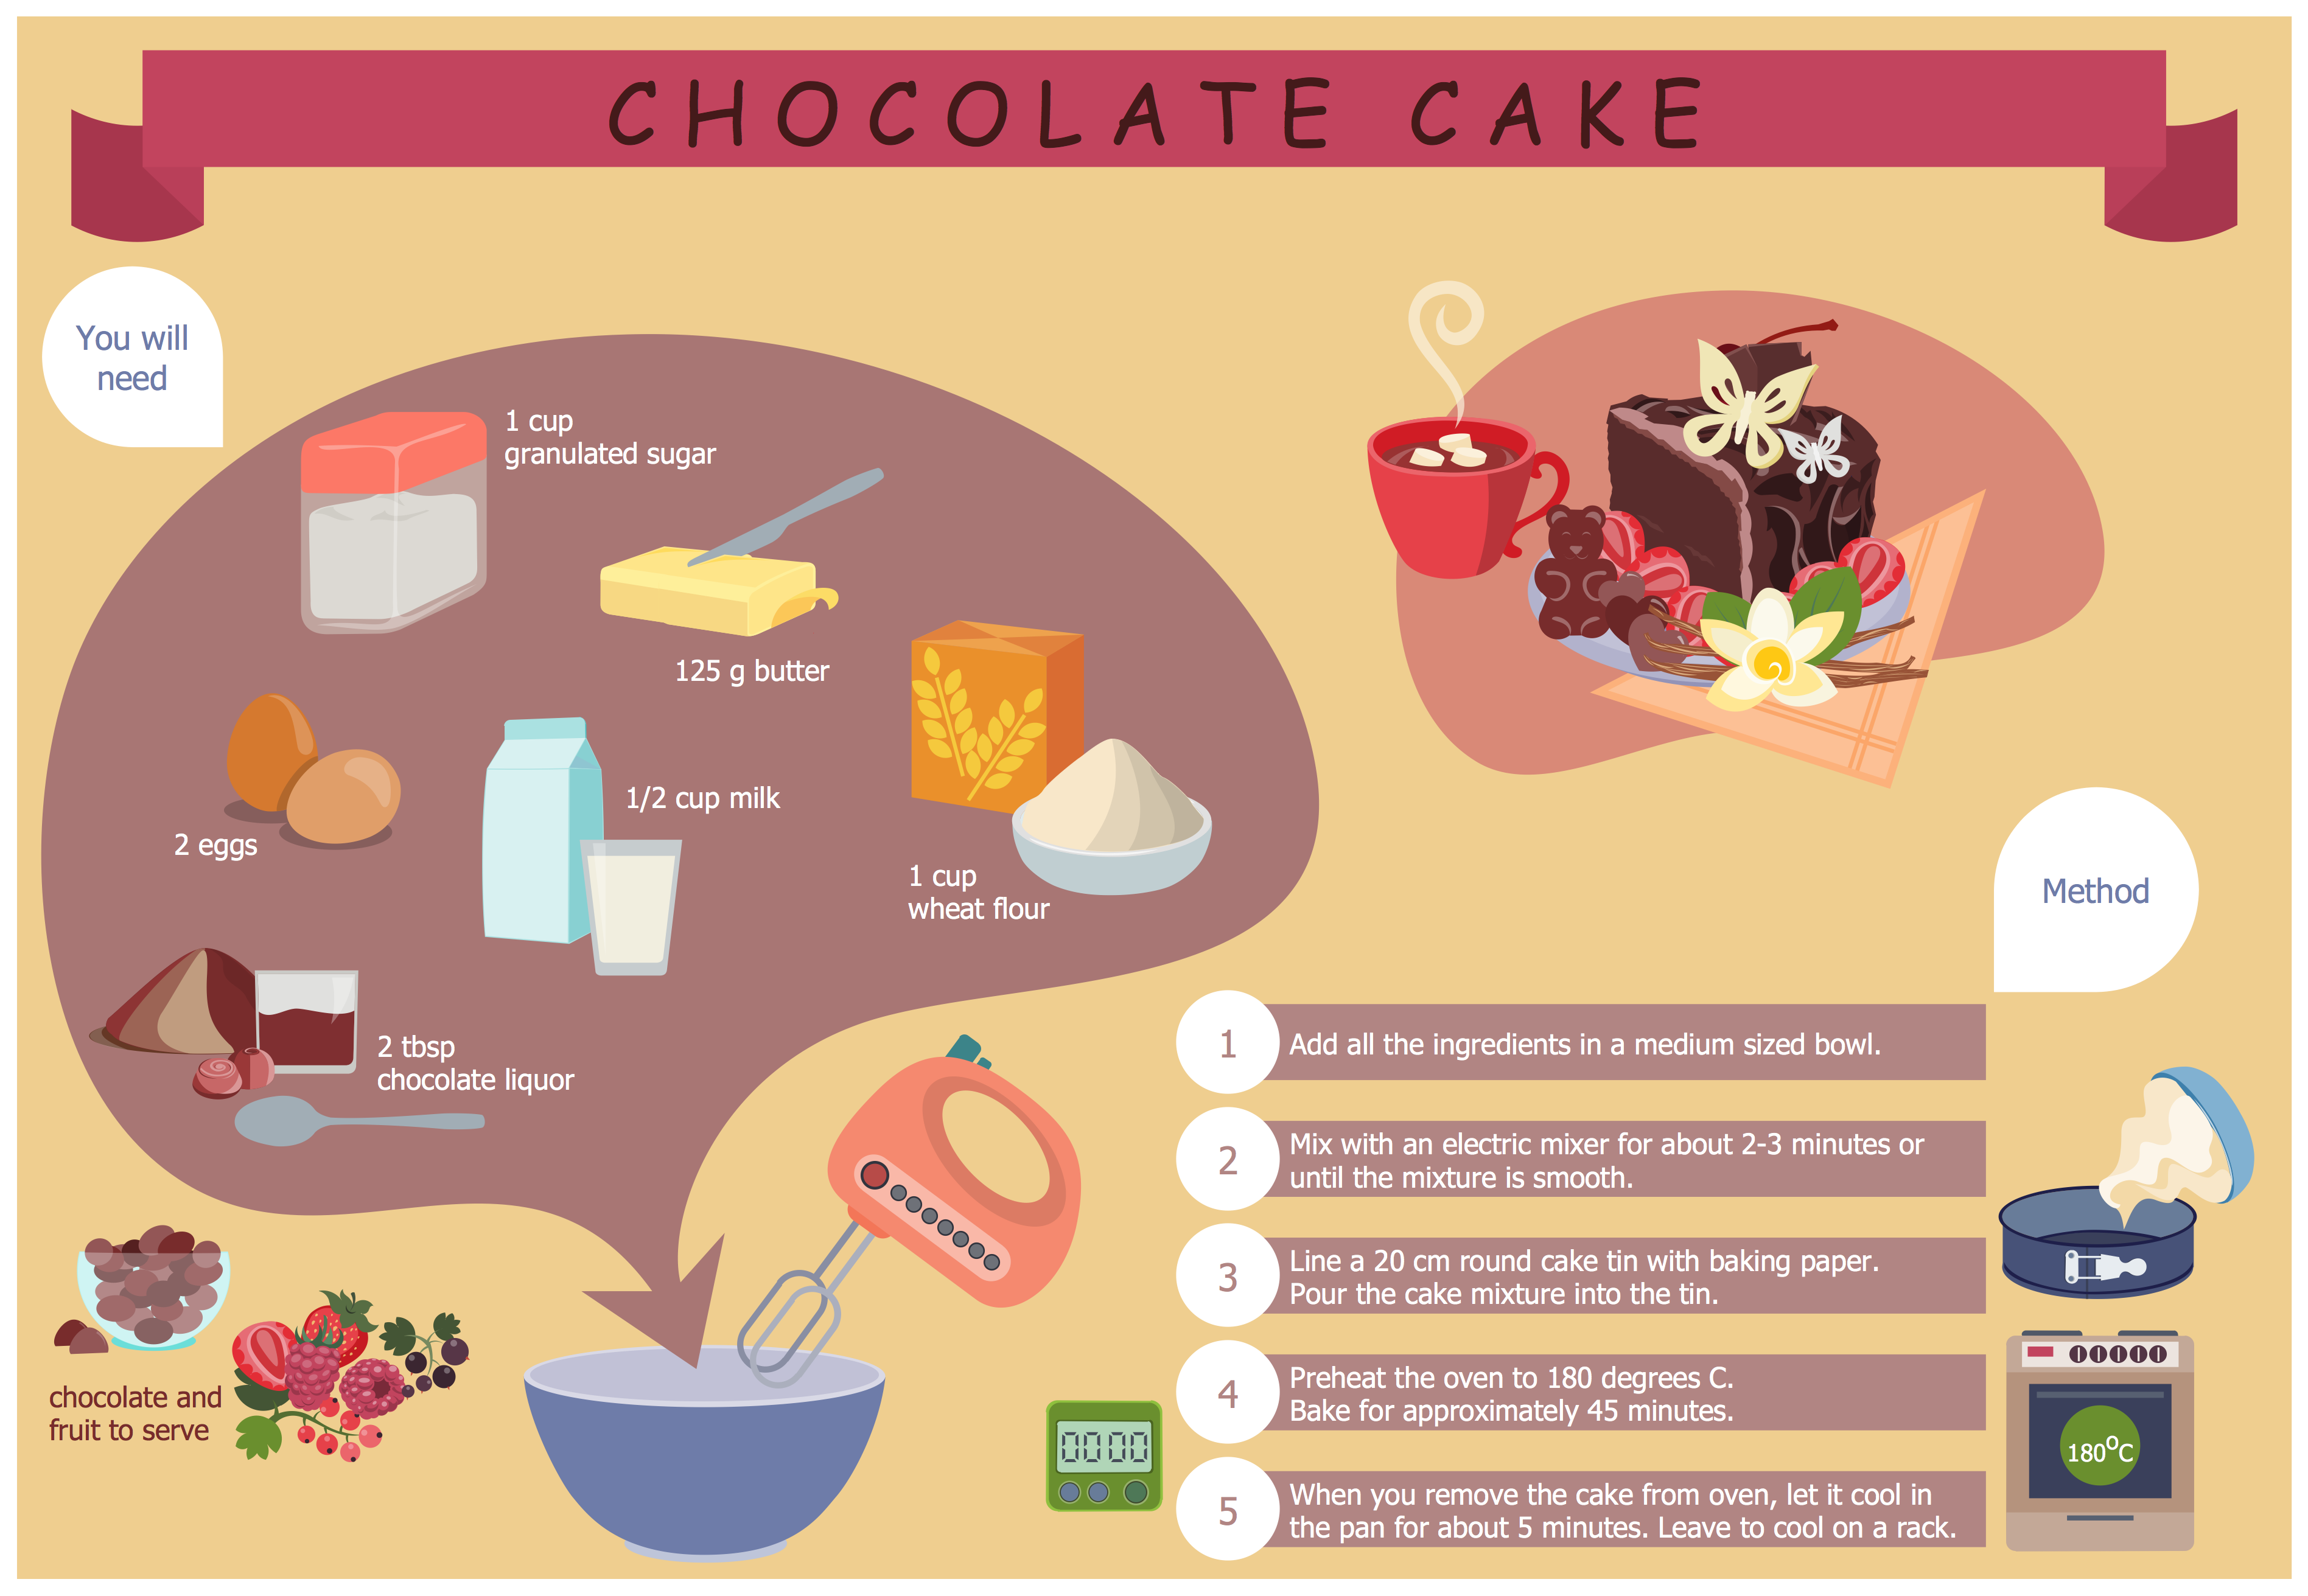
Picture: Easy Recipes
Related Solution:
Collaborating with co-workers is very important, not only in order to get things done effectively, but also to keep in touch with the outside world. Great way for business collaboration is Skype.
Picture: Online Collaboration via Skype
Related Solution:
When you decide to represent data without spending lots of time you can effectively generate, change, and update your presentation to best meet your needs with ConceptDraw MINDMAP.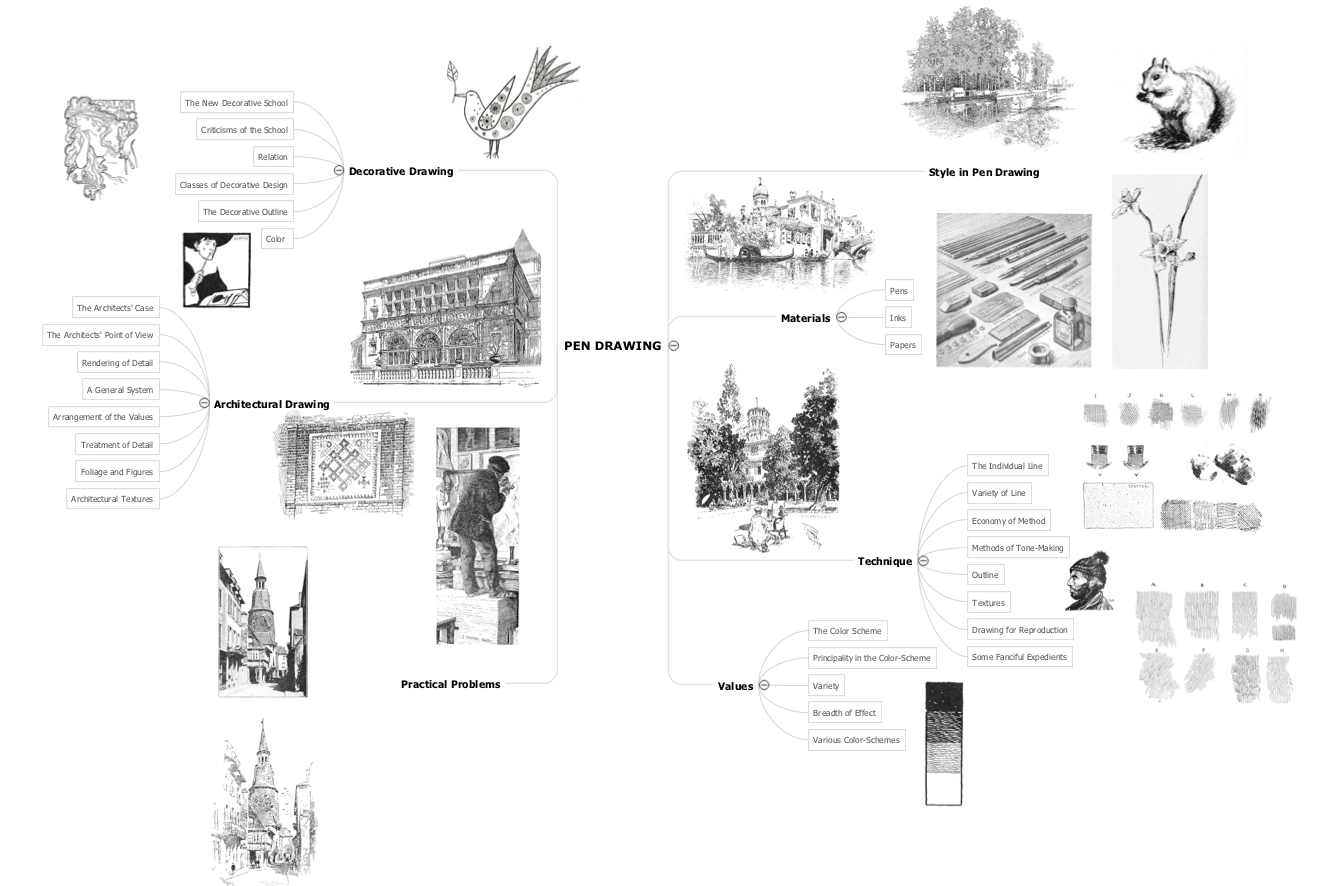
Picture: 3 Ways to Quickly Create Excellent Presentations
Related Solution:
In the course of recent decades data visualization went through significant development and has become an indispensable tool of journalism, business intelligence and science. The way visual information may be conveyed is not limited simply to static or dynamic representation, it can also be interactive. Infographics can be conditionally divided into several general levels. Primarily, this is level of visualization of information, its interpretation and association on any ground. Second level can be defined as a visualization of knowledge, depiction of thoughts and ideas in the form of images or diagrams. Finally, the level of data visualization, which processes data arrays in charts, enabling the information to be more clearly perceived. You can also identify the main approaches to the creation of infographics: exploratory and narrative. Exploratory method insists on minimalist design in favor of data precision without unnecessary details and is common for scientific researches and ana
Picture: Design Pictorial Infographics. Design Infographics
Related Solution:
When you need to visually represent the structure of relational database, Entity relationship diagram (ERD) is a type of diagram for that case.
Most entity-relationship diagrams can be built with objects from Flowchart solution or ERD Solution which contains inbuilt templates. Follow these steps to create your own custom ERD diagram.
Don't be frightened if it looks complex, ConceptDraw DIAGRAM makes it easy to create an ERD, and hundreds of other diagrams, in minutes.
Picture: Developing Entity Relationship Diagrams
Related Solution:
Local area network connects computers and other network appliances within an area, such as office building or a campus. It can be difficult to provide such network without a predesigned plan. For these purposes you can use network diagram software, which helps you to create LAN network diagrams and office network diagrams quickly and effortless. This will speed up your work and you can save the diagram for the future network improvements.
The following diagram illustrates a network topology of the small office. LAN configuration has a star topology. The local network joins 8 computers among which are several desktop PCs, laptop, two iMacs and iBook. The end-point devices are divided into three groups. Each group is connected to its hub. There is a network printer and a modem, which are interconnected with other devices through a network server. Each computer on the LAN can access the server through a corresponding hub.
Picture: Network Diagram Software. LAN Network Diagrams. Physical Office Network Diagrams
Related Solution:
The Ishikawa diagram, Cause and Effect diagram, Fishbone diagram — all they are the names of one and the same visual method for working with causal connections. Originally invented by Kaoru Ishikawa to control the process quality, the Ishikawa diagram is well proven in other fields of management and personal scheduling, events planning, time management. It is a chart in the form of a fish, whose head is a problem, the fins are variants for its causes.
To design easily the Fishbone diagram, you can use a special ConceptDraw DIAGRAM vector graphic and diagramming software which contains the powerful tools for Fishbone diagram problem solving offered by Fishbone Diagrams solution for the Management area of ConceptDraw Solution Park.
Picture: Fishbone Diagram Problem Solving
Related Solution:
ConceptDraw MINDMAP has a addition to the ConceptDraw Solution Park that provides a creative approach to visualizing quality processes, Quality Mind Map Solution.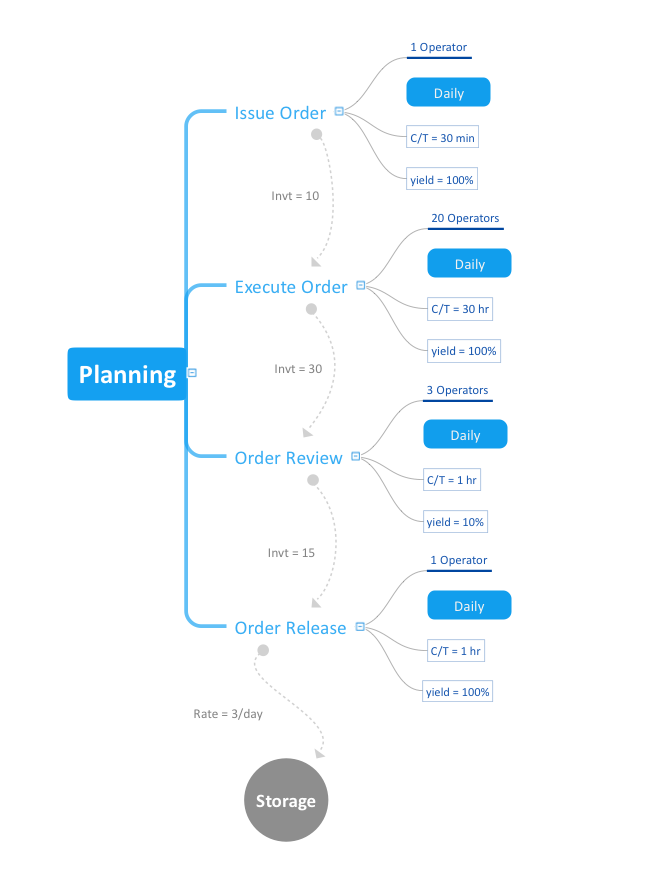
Picture: Mind Mapping in the Quality Management
Related Solution:


