Made with
ConceptDraw
DIAGRAM 17

Flowchart

What is a Flowchart

A flowchart is a type of diagram which visually represents an algorithm, workflow or process. Flowcharts can depict a process of any complexity and length. In practice, flowcharts are most commonly used to illustrate business processes and represent the logic of computer programs. They are also used in education and business scenarios where it is necessary to represent a process in a clear and intuitive format.

A flowchart is made up of different object blocks which represent various states of a process. Some objects may represent actions, while others represent various exchanges of a process, depending on its current state.

Flowchart - Selection Sorting Method

Example 1. Flowchart — Selection Sorting Method

The flowchart commonly uses the following objects:

  • Rectangle or box is a most often used symbol, it represents an activity or a step;
  • Rounded box or oval usually contains the word "Start" or "End";
  • Diamond is used to represent the decision point, it usually involves the branching yes/no;
  • Circle is used to represent the point of connection the flowchart to another process;
  • Parallelogram represents the Input/Output.

Object blocks are usually connected by arrows to demonstrate the process flow. One object may be connected to multiple objects from various directions.

Flowchart bloks

If an object presents several actions for different decisions or conditions within the process, the outgoing arrows are labeled with comments. The most common are the Yes/No blocks, although other types of conditional blocks are used to illustrate complex decisions.

Certain processes within a business include operations that run in a loop. In this case an object block must contain a loop end condition.

Flowchart Connection

Benefits of Flowchart

The Flowchart has a wide set of benefits:

  • gives a clear documentation of a process;
  • allows to define and offers common understanding of processes;
  • helps to build a process visual representation for analysis, discussion, and communication;
  • allows to identify the scope of the process;
  • allows to trace and analyze the process steps;
  • helps to standardize and find areas for monitoring, improvement and increased efficiency in a process;
  • allows to find and detach the steps of the process that are not essential;
  • helps in understanding the logic of complex problems;
  • offers a guidance for managers overseeing operations;
  • facilitates communication between programmers and business people;
  • helps programmers to write the programs of any complexity and on the any high level language;
  • helps in debugging process and provides efficient program maintenance;
  • helps to understand and explain to other people the logic of the complex problems and their solution;
  • assists to improve teamwork effectiveness.

Flowchart Software

ConceptDraw DIAGRAM is a powerful flowchart software thanks to the Flowcharts Solution from the "Diagrams" Area of ConceptDraw Solution Park and its set of useful tools which will help to make easier depicting your business processes, flowchart processes and creating professional Flowchart Diagrams of any complexity.

Flowchart in ConceptDraw DIAGRAM title=

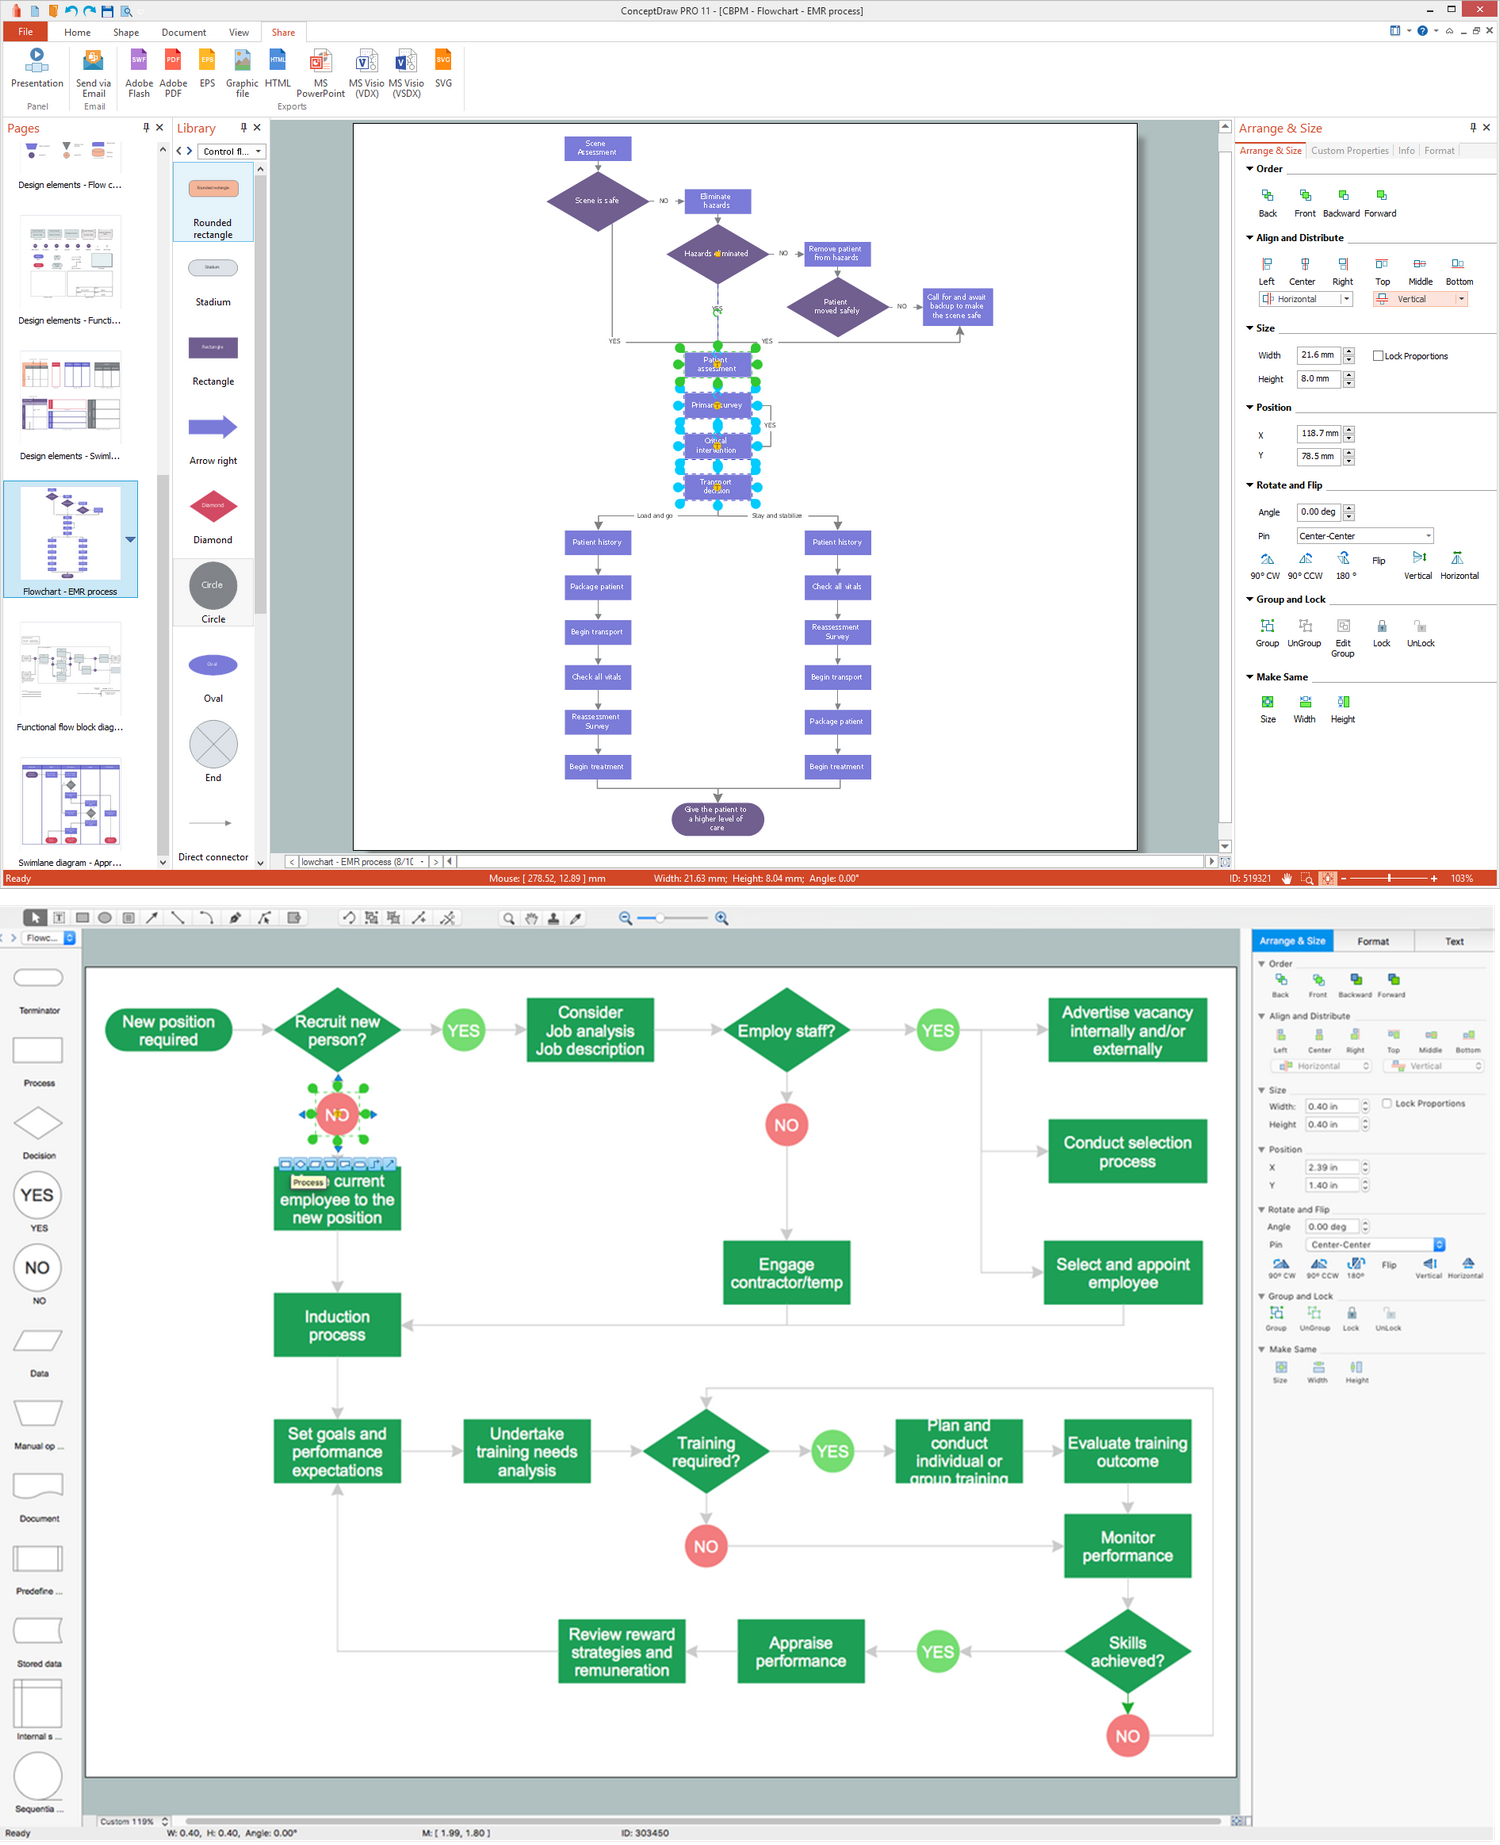
Example 2. Flowchart in ConceptDraw DIAGRAM (Mac OS X™ and Windows™)

The Flowcharts Solution provides the extensive Flowchart and Flowcharts Rapid Draw libraries of ready-made symbols and blocks.


The Flowcharts Solution provides also ready-to-use template which can be filled in a few minutes, and numerous collection of predesigned samples and examples of flowchart diagrams of various types, such as flowchart process diagram, business process flow chart, data flow chart, org flow chart, program flow chart, technical flow chart, flowchart procedure, online flowchart, and many other types.

All samples and template included in Flowcharts Solution are available for viewing and editing from ConceptDraw STORE.

Flowchart *

Example 3. Flowchart — Website Login and Registration Process

This sample was created in ConceptDraw DIAGRAM flowcharting software using the tools of Flowcharts Solution from the "Diagrams" Area of ConceptDraw Solution Park. It shows the detailed flowchart for the process of website login and registration. An experienced user spent 15 minutes creating this sample.

Use the Flowcharts Solution for ConceptDraw DIAGRAM software to create your own Flowchart of any complexity quick and easy.

All source documents are vector graphic documents. They are available for reviewing, modifying, or converting to a variety of formats (PDF file, MS PowerPoint, MS Visio, and many other graphic formats) from the ConceptDraw STORE. The Flowcharts Solution is available for all ConceptDraw DIAGRAM or later users.


TEN RELATED HOW TO's:
This sample shows the Flowchart of the testing the work of the lamp and decision making about what to do to lamp will work.Samples of Flowchart *
Picture: Samples of Flowchart
Related Solution:
It is convenient to represent various routes, directions, roads on the directional maps and navigation schemes. ConceptDraw DIAGRAM diagramming and vector drawing software supplied with Directional Maps Solution from the Maps Area of ConceptDraw Solution Park is effective for drawing Directions Maps.Directions Maps *
Picture: Directions Maps
Related Solution:
Event-Driven Process Chain Diagrams for improvement throughout an organisation. ConceptDraw DIAGRAM - software that reduces the time needed to create a business process model.Modelling Complex Events with Event-Driven Process chain *
Picture: Modelling Complex Events with Event-Driven Process chain
Related Solution:
It’s very convenient to explain the different tactics and positions using the visual drawings. ConceptDraw DIAGRAM software extended with the Soccer solution from the Sport area of ConceptDraw Solution Park provides libraries, templates and samples allowing specialists or soccer fans to draw the soccer-related diagrams and schemas of any complexity in a few minutes.Soccer (Football) Offside *
Picture: Soccer (Football) Offside
Related Solution:
Sometimes it's difficult to find a path in work processes or to understand the requirements, especially when you are a newcomer. To get your thoughts straight, create a workflow diagram, and put everything on it. This will not only help you to get into the workflow, but also show it’s weaknesses. This illustration captures the workflow process of payment an invoice for the electricity consumed by certain enterprise. It was drawn in ConceptDraw DIAGRAM using its solution for Workflow Diagrams. Making a workflow charts means that you need to depict consistently all processes engaged to the workflow process. Then, you should connect them with symbols meaning study and analysis. Next, add symbols of decisions. A work flow diagram made precisely and correctly can help to clarify your work flow to any person.Workflow Diagram *
Picture: Workflow Diagram
Related Solution:
UML Class Diagrams is a type of static structure diagram that is used both for general conceptual modeling of the systematics of the application, and for detailed modeling translating the models into programming code. It describes the structure of a system by showing the: classes of a system, attributes, operations, and the relationships between them. The Rapid UML Solution for ConceptDraw DIAGRAM includes the UML Class Diagram library that helps you to design the UML Class Diagram quick and easy. You can simply and quickly drop the ready-to-use objects from the library into your document to create the UML Class Diagram.UML Class Diagram Constructor *
Picture: UML Class Diagram Constructor
Related Solution:
ConceptDraw gives the ability to draw Flowchart documents. Flowcharts solutionis a powerful tool that extends ConceptDraw application for drawing business flowcharts. ConceptDraw DIAGRAM vector diagramming and business graphics software enhanced with with templates, green and interactive flowchart makers, samples and stencil libraries from ConceptDraw Solution Park which all focused to help with drawing flowcharts, block diagrams, bar charts, histograms, pie charts, divided bar diagrams, line graphs, area charts, scatter plots, circular arrows diagrams, Venn diagrams, bubble diagrams, concept maps, and others.The Best Flowchart Software Available *
Picture: The Best Flowchart Software Available
Related Solution:
Visual navigation through the stages of a response process helps you locate specific actions to be taken via Action Mind Maps. Use ConceptDraw DIAGRAM and ConceptDraw MINDMAP for organize the process of response for interactions occurring in social media.Create Response Charts *
Picture: Create Response Charts
Related Solution:
This sample shows the Data Flow Diagram of the Taxi Service and interactions between the Clients, Operators and Divers, as well as Orders and Reports databases.Taxi Service Data Flow Diagram<br>DFD Example *
Picture: Taxi Service Data Flow DiagramDFD Example
Related Solution:
ConceptDraw
DIAGRAM 17