Flow Diagrams
Flow diagram is a diagram used for structuring complex system and visually representing a flow and interactions of elements in a system.
ConceptDraw DIAGRAM diagramming and vector drawing software enhanced with Flowcharts Solution from the "Diagrams" Area of ConceptDraw Solution Park is perfect for easy drawing professional looking Flow Diagrams.

Example 1. Flow Diagrams in ConceptDraw DIAGRAM - Synthetic Object Construction
For drawing Flow Diagrams the Flowcharts Solution provides:
- 2 libraries with commonly used predesigned vector objects - Flowchart library and Flowcharts Rapid Draw library,
- collection of Flow Diagrams samples,
- Basic Flowchart template.

Example 2. Flow Diagrams - Selection Sorting Method
Use of ready objects is a fastest way of drawing professional looking, vivid and attractive Flow Diagrams.
Don't afraid to make your diagrams colorful! Use bright colors, they make your diagrams successful. It's not obligatory brightly paint entire diagram, you can highlight the parts which need special attention.

Example 3. Flow Diagrams - Online Flowchart
The Flow Diagrams you see on this page were created in ConceptDraw DIAGRAM software using the tools of Flowcharts Solution. These samples successfully demonstrate solution's capabilities and professional results you can achieve. An experienced user spent 10 minutes creating each of them.
Use the Flowcharts Solution for quick, easy and effective drawing professional looking Flow Diagrams.
All source documents are vector graphic documents. They are available for reviewing, modifying, or converting to a variety of formats (PDF file, MS PowerPoint, MS Visio, and many other graphic formats) from the ConceptDraw STORE. The Flowcharts Solution is available for all ConceptDraw DIAGRAM or later users.
See also Samples:
TEN RELATED HOW TO's:
Functional modeling allows to make complex business processes simple. One of the basic methods is IDEF0 and one of the most effective also. To create a business model, use flowchart symbols.
The IDEF0 library, supplied with ConceptDraw IDEF0 Diagrams solution contains 18 IDEF0 basic notation symbols. All symbols are the vector graphic images what means, that one can customize their size preserving the stable quality. Another library of IDEF0 symbols can be find out in the the Business Process Diagrams solution, included to the Business Processes section of ConceptDraw Solution Park. These libraries composed from just vector objects and are totally compatible. You can apply the IDEF0 symbols from both libraries at your flowcharts, if needed.
Picture: IDEF0 Flowchart Symbols
Related Solution:
It is so simple making the drawing process easier and faster. you just need to choose the right drawing software.
ConceptDraw Arrows10 Technology - This is so easy and fast to draw any type of diagram with any degree of complexity.
Picture: Simple & Fast Diagram Software
Related Solutions:
An onion diagram is a kind of chart that shows the dependencies among parts of an organization or process. The chart displays items in concentric circles, where the items in each ring depend on the items in the smaller rings. The Onion Diagram is able to show layers of a complete system in a few circles.
But how to create Onion Diagram? Now, it's very easy thanks to the ConceptDraw DIAGRAM diagramming and vector drawing software extended with Stakeholder Onion Diagrams Solution from the Management Area of ConceptDraw Solution Park.
Picture: How To Create Onion Diagram
Related Solution:
When searching for a diagramming tool, we look for a powerful and reliable software that would be easy to use. To mention one, ConceptDraw DIAGRAM has all the necessary features to create cross-functional flowcharts (Swim Lanes) quick and effortlessly. You can draw swim lane diagrams in both vertical and horizontal ways.
This cross-functional flowchart displays a payroll process. It explains to each participant his role in the process depending on the category, represented with swimlanes. Using this flowchart, every employee can easily find out what he can expect in terms of salary. Generally a cross-functional diagram enables one to take a look at processes with a wider scope and with more precision than simple flowchart. Business process capturing using cross-functional flowcharts can be useful for stakeholders and managers to define clearly the staff's roles and responsibilities.
Picture: Cross-Functional Flowchart (Swim Lanes)
Related Solution:
What is information architecture? Information architecture (IA) is a broad and abstract term. At the most general sense the information architecture describes the structure of a system, how the different pieces of information are related at the system and represents their relationships. The information architecture term was introduced by Richard Saul Wurman in 1975 and now is commonly used in the context of websites and intranets, information structures and computer systems.
ConceptDraw DIAGRAM extended with Enterprise Architecture Diagrams Solution from the Management Area is the best software for design information architecture and drawing Enterprise Architecture Diagrams.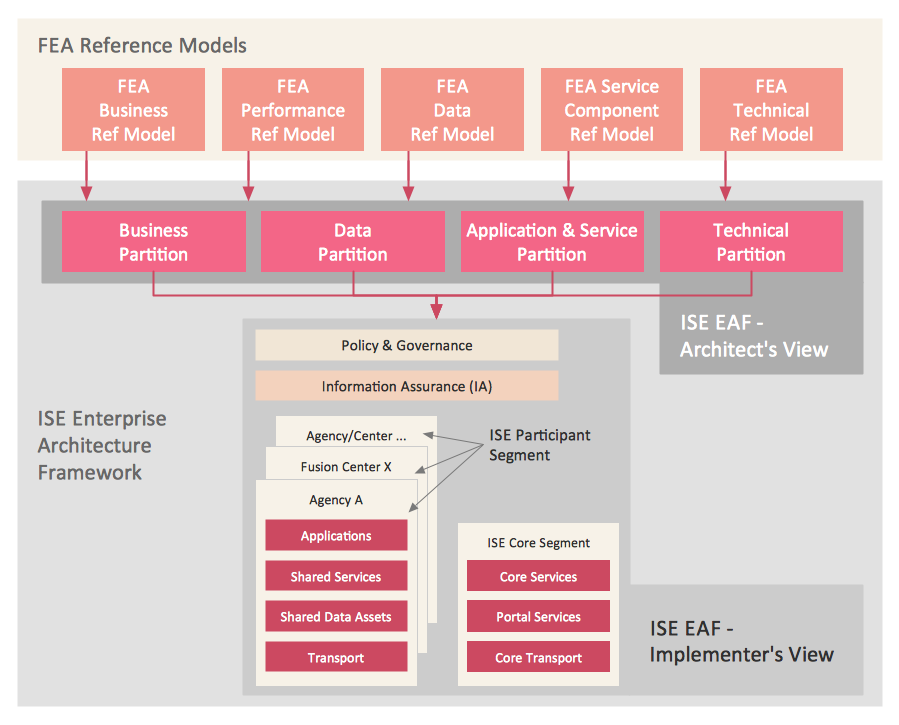
Picture: What Is Information Architecture
Related Solution:
If your company is in chaos in clutter and no one understands their rights and responsibilities, maybe it's time to change that. One of the ways to put the company in order is to draw an organization chart that would reflect the structure and show the relationships among departments and positions. This is a very useful and easy to understand scheme.
This is example of the one of the most typical kind of organizational chart. It depicts an organizational structure of the hierarchical type. Its construction is similarv to pyramid. The single main position on the top - in this case, the mayor's position followed by sub-levels of authority in his command. Each position in the pyramid reports only to his supervisor, and takes only a report of direct subordinates. Such scheme limits the number of communications. This organizational structure is effectively used in public organizations. Also it is suitable for any organization with the need for multiple levels of middle managers. The ability to create organizational charts of different types is supplied with ConceptDraw Ogrcharts solutions.
Picture: How to Draw an Organizational Chart
Related Solution:
A flowchart can take any process and distil it into a series of actions or decisions; it is a versatile and simple form of diagram that can be used to describe situations in any field, and is easily understood by everyone. They are used frequently in business to document workflows from all areas of a company - they can show accounting purchase orders, human resource recruitment strategy, or a product life cycle.
ConceptDraw DIAGRAM diagramming and vector drawing software extended with Flowcharts Solution from the Diagrams Area of ConceptDraw Solution Park is a perfect powerful tool for extremely easy designing professional looking Flow Diagram.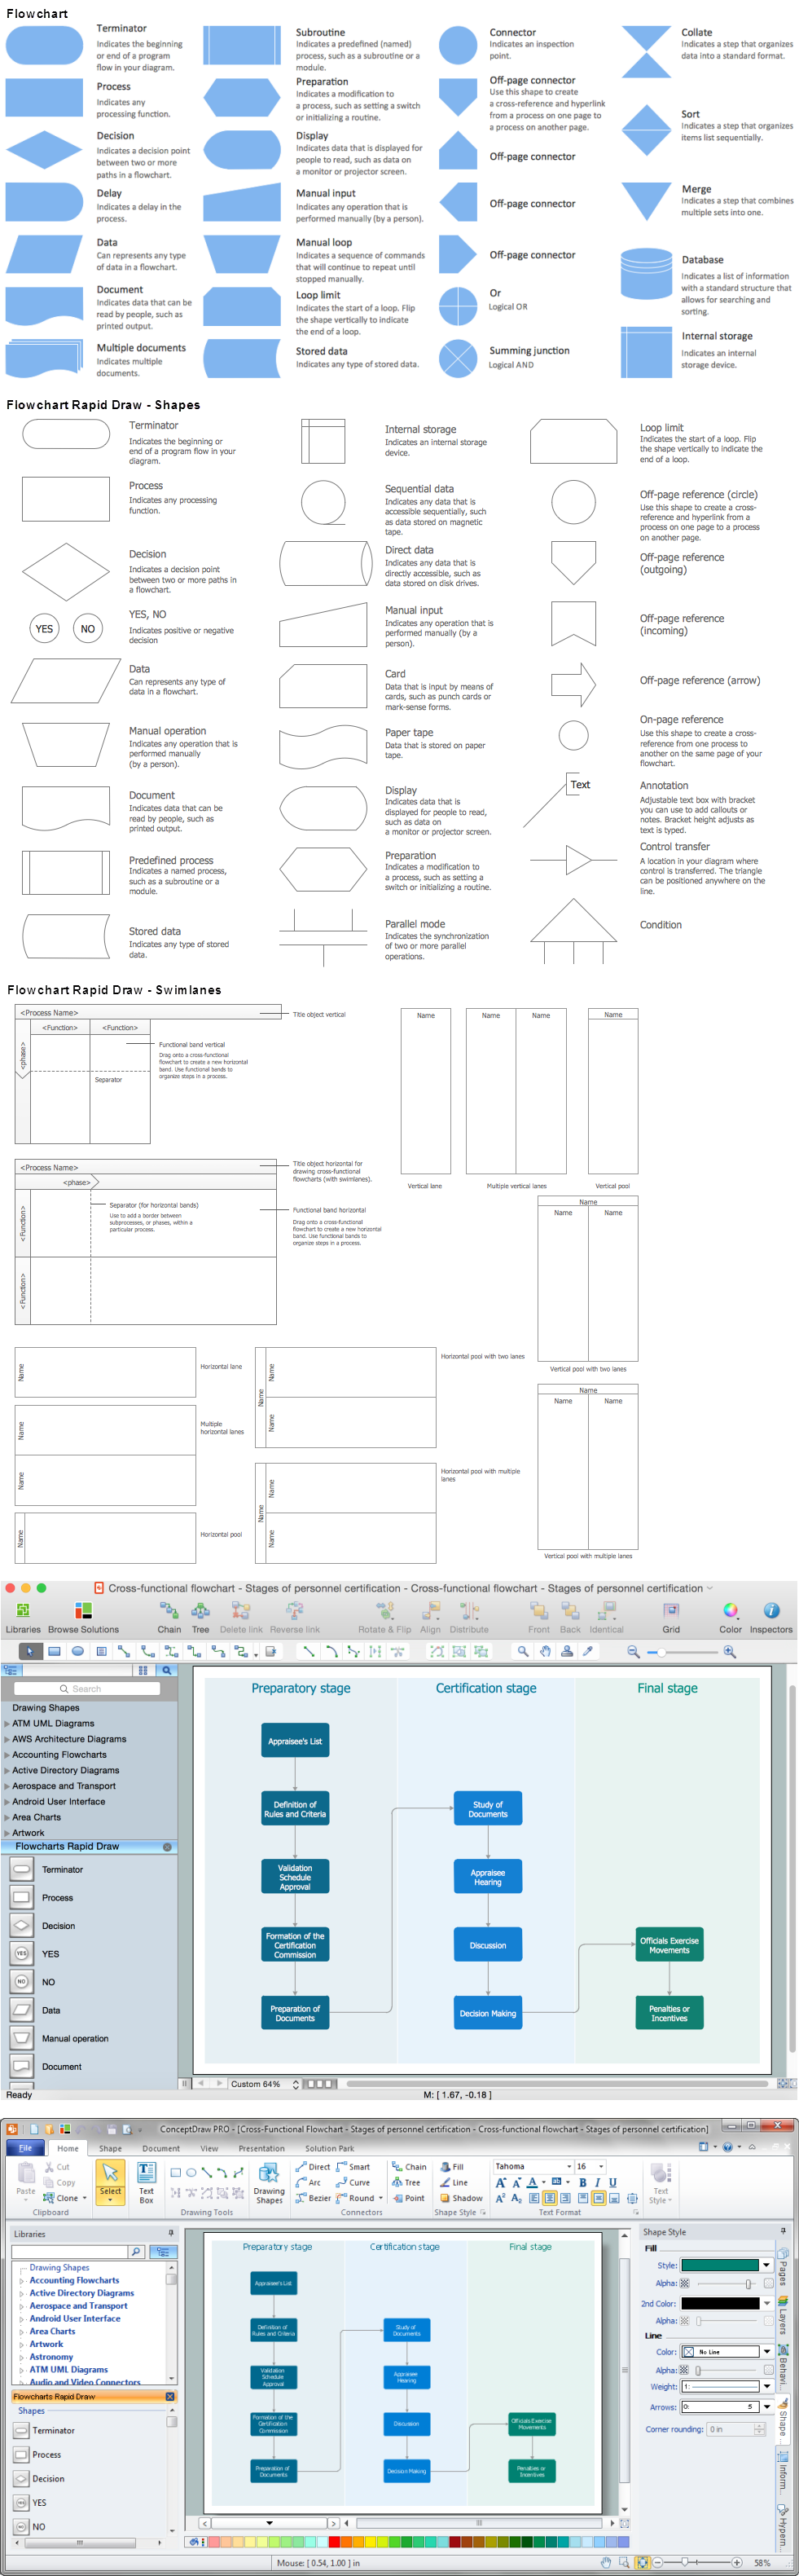
Picture: Flow Diagram
Related Solution:
This sample shows the Flowchart that displays the layout and work flow of the cloud marketing platform. This diagram has a style of the marketing brochure. This style displays the central product that is related to the other issues.
Using the ready-to-use predesigned objects, samples and templates from the Flowcharts Solution for ConceptDraw DIAGRAM you can create your own professional looking Flowchart Diagrams quick and easy.
Picture: Flowchart Marketing Process. Flowchart Examples
Related Solution:

