Data Flow Diagram Example
ConceptDraw DIAGRAM extended with Data Flow Diagrams solution is the best diagramming and vector drawing software for quick and easy designing the Data Flow Diagram Example of any complexity.
Data Flow Diagrams solution is one of solutions included in Software Development Area. Draw the perfect data flow diagrams and also UML Diagrams, ERD Diagrams, iPhone and Win8 user interfaces, and other diagrams using the numerous solutions of Software Development Area.

Example 1. Data Flow Diagram Example
This Data Flow Diagram example was created in ConceptDraw DIAGRAM using the tools of Data Flow Diagrams Solution and illustrates a business process using the Gane-Sarson Notation. An experienced user spent 10 minutes creating this example. This professional looking Data Flow Diagram example can be successfully used in business documents, for presentations, and on websites.
Use Data Flow Diagrams solution for designing your own Data Flow Diagrams quick, easy and effective.
All source documents are vector graphic documents. They are available for reviewing, modifying, or converting to a variety of formats (PDF file, MS PowerPoint, MS Visio, and many other graphic formats) from the ConceptDraw STORE. The Data Flow Diagrams Solution is available for all ConceptDraw DIAGRAM or later users.
See also samples:
TEN RELATED HOW TO's:
A flowchart is a powerful tool for examining processes. It helps improving processes a lot, as it becomes much easier to communicate between involved people, to identify potential problems and to optimize workflow. There are flowcharts of different shapes, sizes and types of flowchart vary from quite basic process flowcharts to complex program flowcharts. Nevertheless, all these diagrams use the same set of special symbols like arrows to connect blocks, parallelogram to show data receiving or rectangles for showing process steps.
Basic flowcharts are used to represent a simple process algorithm. A basic flowchart notation consists of rectangles (business processes), arrows (the flow of information, documents, etc.). The same notation is used in items such as the "decision", which allow you to do the branching. To indicate the start of the entire business process and its termination can be used the "Terminator" element. The advantages of Basic Flowchart are simplicity and clarity. With it you can quickly describe the business process steps. Creating of Basic Flowchart does not require any special knowledge, as easily understand by employees with different levels of education and IQ.
Picture: Types of Flowchart - Overview
Related Solution:
While creating flowcharts and process flow diagrams, you should use special objects to define different statements, so anyone aware of flowcharts can get your scheme right. There is a short and an extended list of basic flowchart symbols and their meaning. Basic flowchart symbols include terminator objects, rectangles for describing steps of a process, diamonds representing appearing conditions and questions and parallelograms to show incoming data.
This diagram gives a general review of the standard symbols that are used when creating flowcharts and process flow diagrams. The practice of using a set of standard flowchart symbols was admitted in order to make flowcharts and other process flow diagrams created by any person properly understandable by other people. The flowchart symbols depict different kinds of actions and phases in a process. The sequence of the actions, and the relationships between them are shown by special lines and arrows. There are a large number of flowchart symbols. Which of them can be used in the particular diagram depends on its type. For instance, some symbols used in data flow diagrams usually are not used in the process flowcharts. Business process system use exactly these flowchart symbols.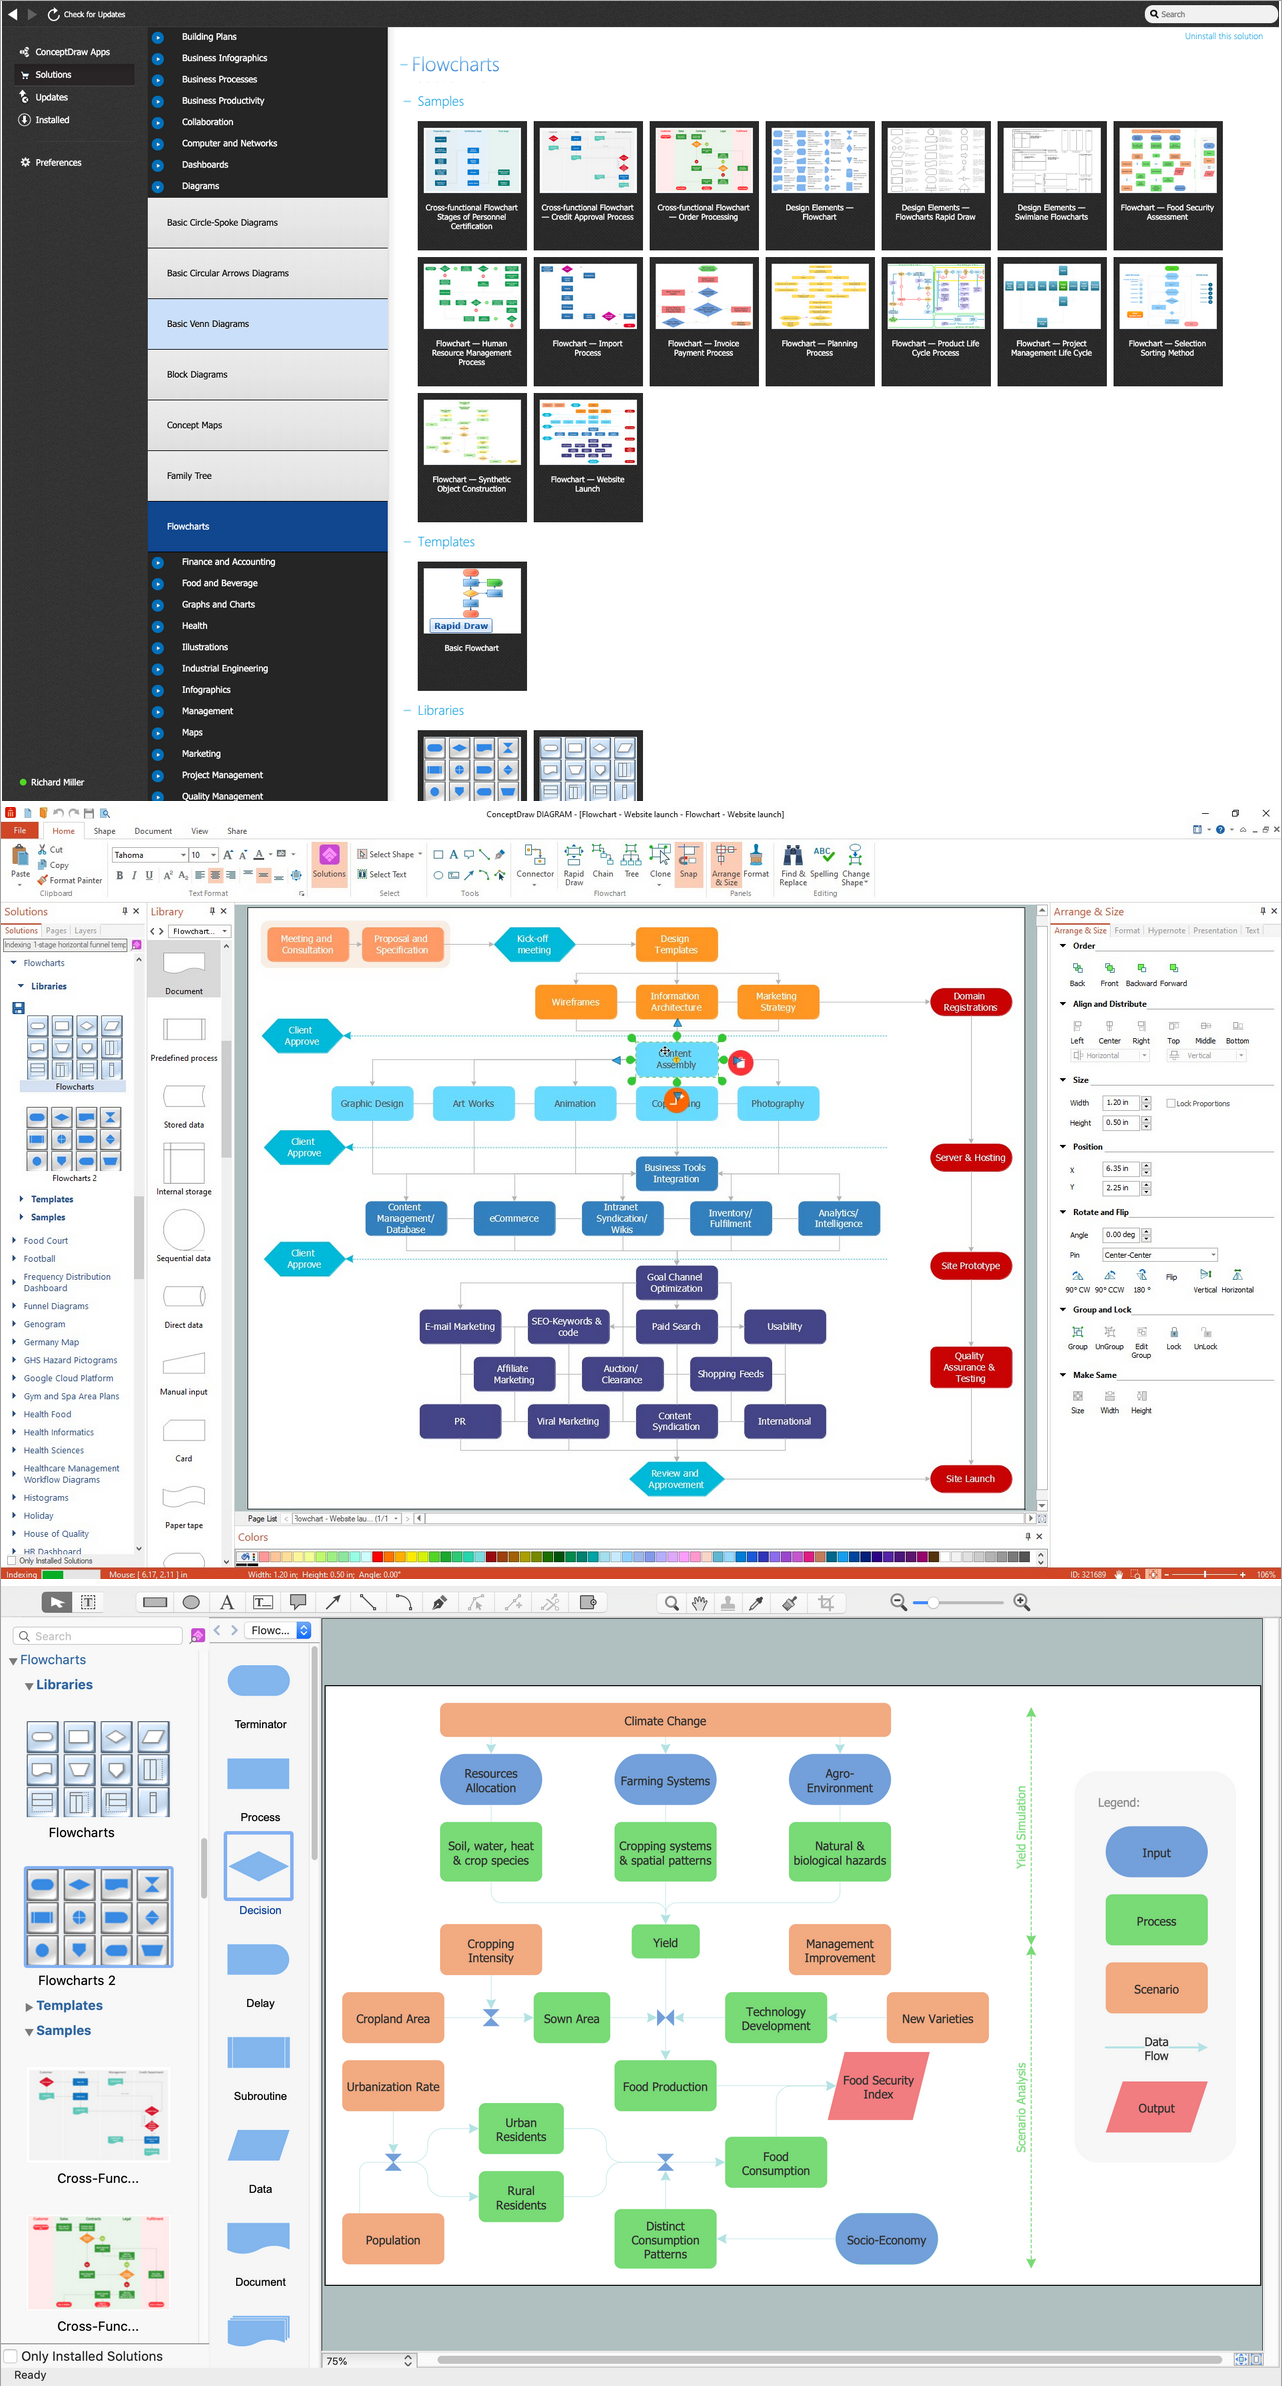
Picture: Basic Flowchart Symbols and Meaning
Related Solution:
How to Draw ER Diagrams? With Entity-Relationship Diagram (ERD) solution from the Software Development Area for ConceptDraw Solution Park you are able to draw ER diagram with no problem. It includes 45 predesigned icons advocated by popular Chen's and Crow’s Foot notations that can be used when describing an enterprise database.
Picture: How to Draw ER Diagrams
Related Solution:
Entity structure diagram (ESD) notations may be created in the ConceptDraw DIAGRAM same as any other diagram, including a Jackson Structured Programming (JSP) Diagram. Having the Jackson Structured Programming (JSP) Diagrams solution may simplify the work of drawing the needed illustration representing the given data within only a few minutes. Having the pre-made examples of the JSP diagrams, any ConceptDraw DIAGRAM user is able to make his own unique as well as smart looking drawing in a fun and entertaining way.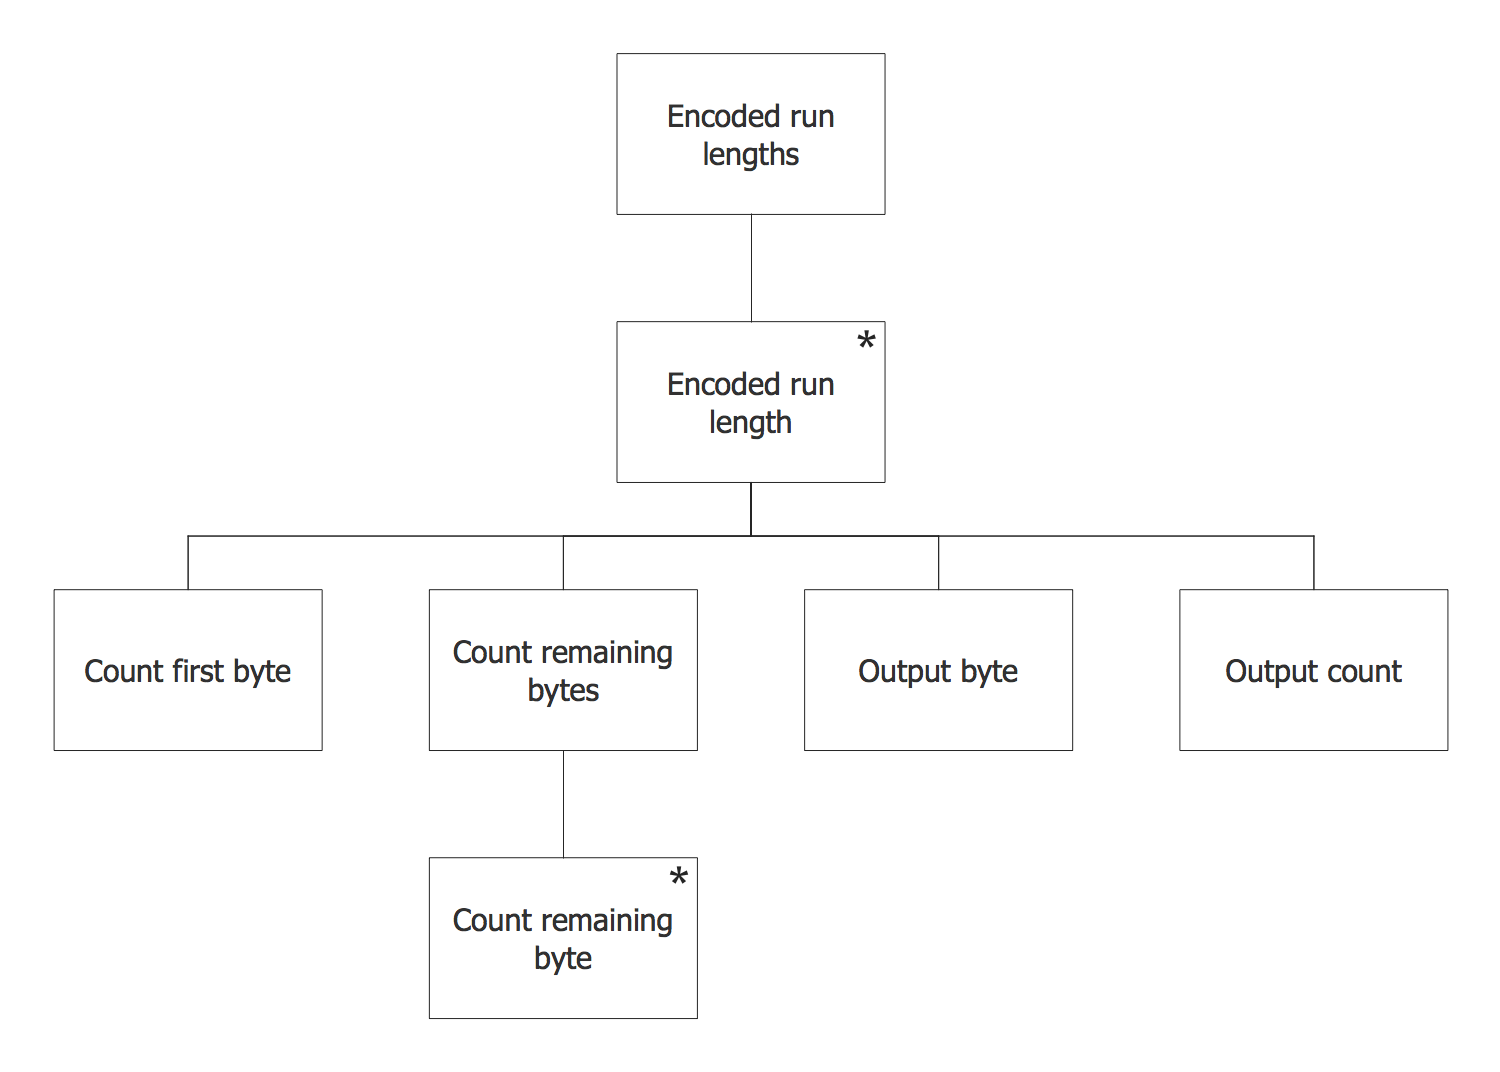
Picture: Jackson Systems
Related Solution:
Database model is a graphic representation need at the beginning of project development. You won't have any problems with drawing ER diagrams on a Mac anymore with ConceptDraw DIAGRAM application. Special libraries that contain all the symbols of both Chen's and Crow’s foot notation allow you to start database modeling within a few minutes.
Creating entity-relationship diagrams on Mac is fun and effortless when you use a software designed for professional ERD drawing tailored to specific characteristics of Apple OS X. ConceptDraw DIAGRAM is a business diagramming software for those using OS X.
The Entity-Relationship Diagrams solution for ConceptDraw has 2 libraries containing about 50 vector icons, depicting ERD symbols of the most popular Chen's and Crow’s Foot Notations. The other valuable component of the solution is a collection of ERDs samples and templates that can be opened on Macs and PCs.
Picture: Drawing ER diagrams on a Mac
Related Solution:
When we think of an hierarchy, we intuitively imagine a pyramid. Thus, a lot of management tools use pyramid charts as examples or illustrations of various documents or models. You can create any type of triangle diagram using ConceptDraw DIAGRAM.
A triangle (pyramid) diagram is often used in marketing to show the data hierarchy. This pyramid diagram represents the Top Brand Model. It illustrate the model of rebranding strategy. It can be used by marketing agency dealing with rebranding strategies development. It’s critical for marketing diagrams to be both clear and eye catching. ConceptDraw Pyramid diagrams solution meet all these requirements and can be successfully applied for creating and presenting various marketing pyramidal diagrams.
Picture: Pyramid Chart Examples
Related Solutions:
ER diagram is the most popular database design tool which lets create graphical representations of database tables, their columns and also relationships. As for the Mac users, they are very interested in powerful database diagramming tools and ER diagram tool for OS X to design professional looking E-R Diagrams and ERD drawings. ConceptDraw DIAGRAM software on Mac OS X gives the ability to easy draw ERDs.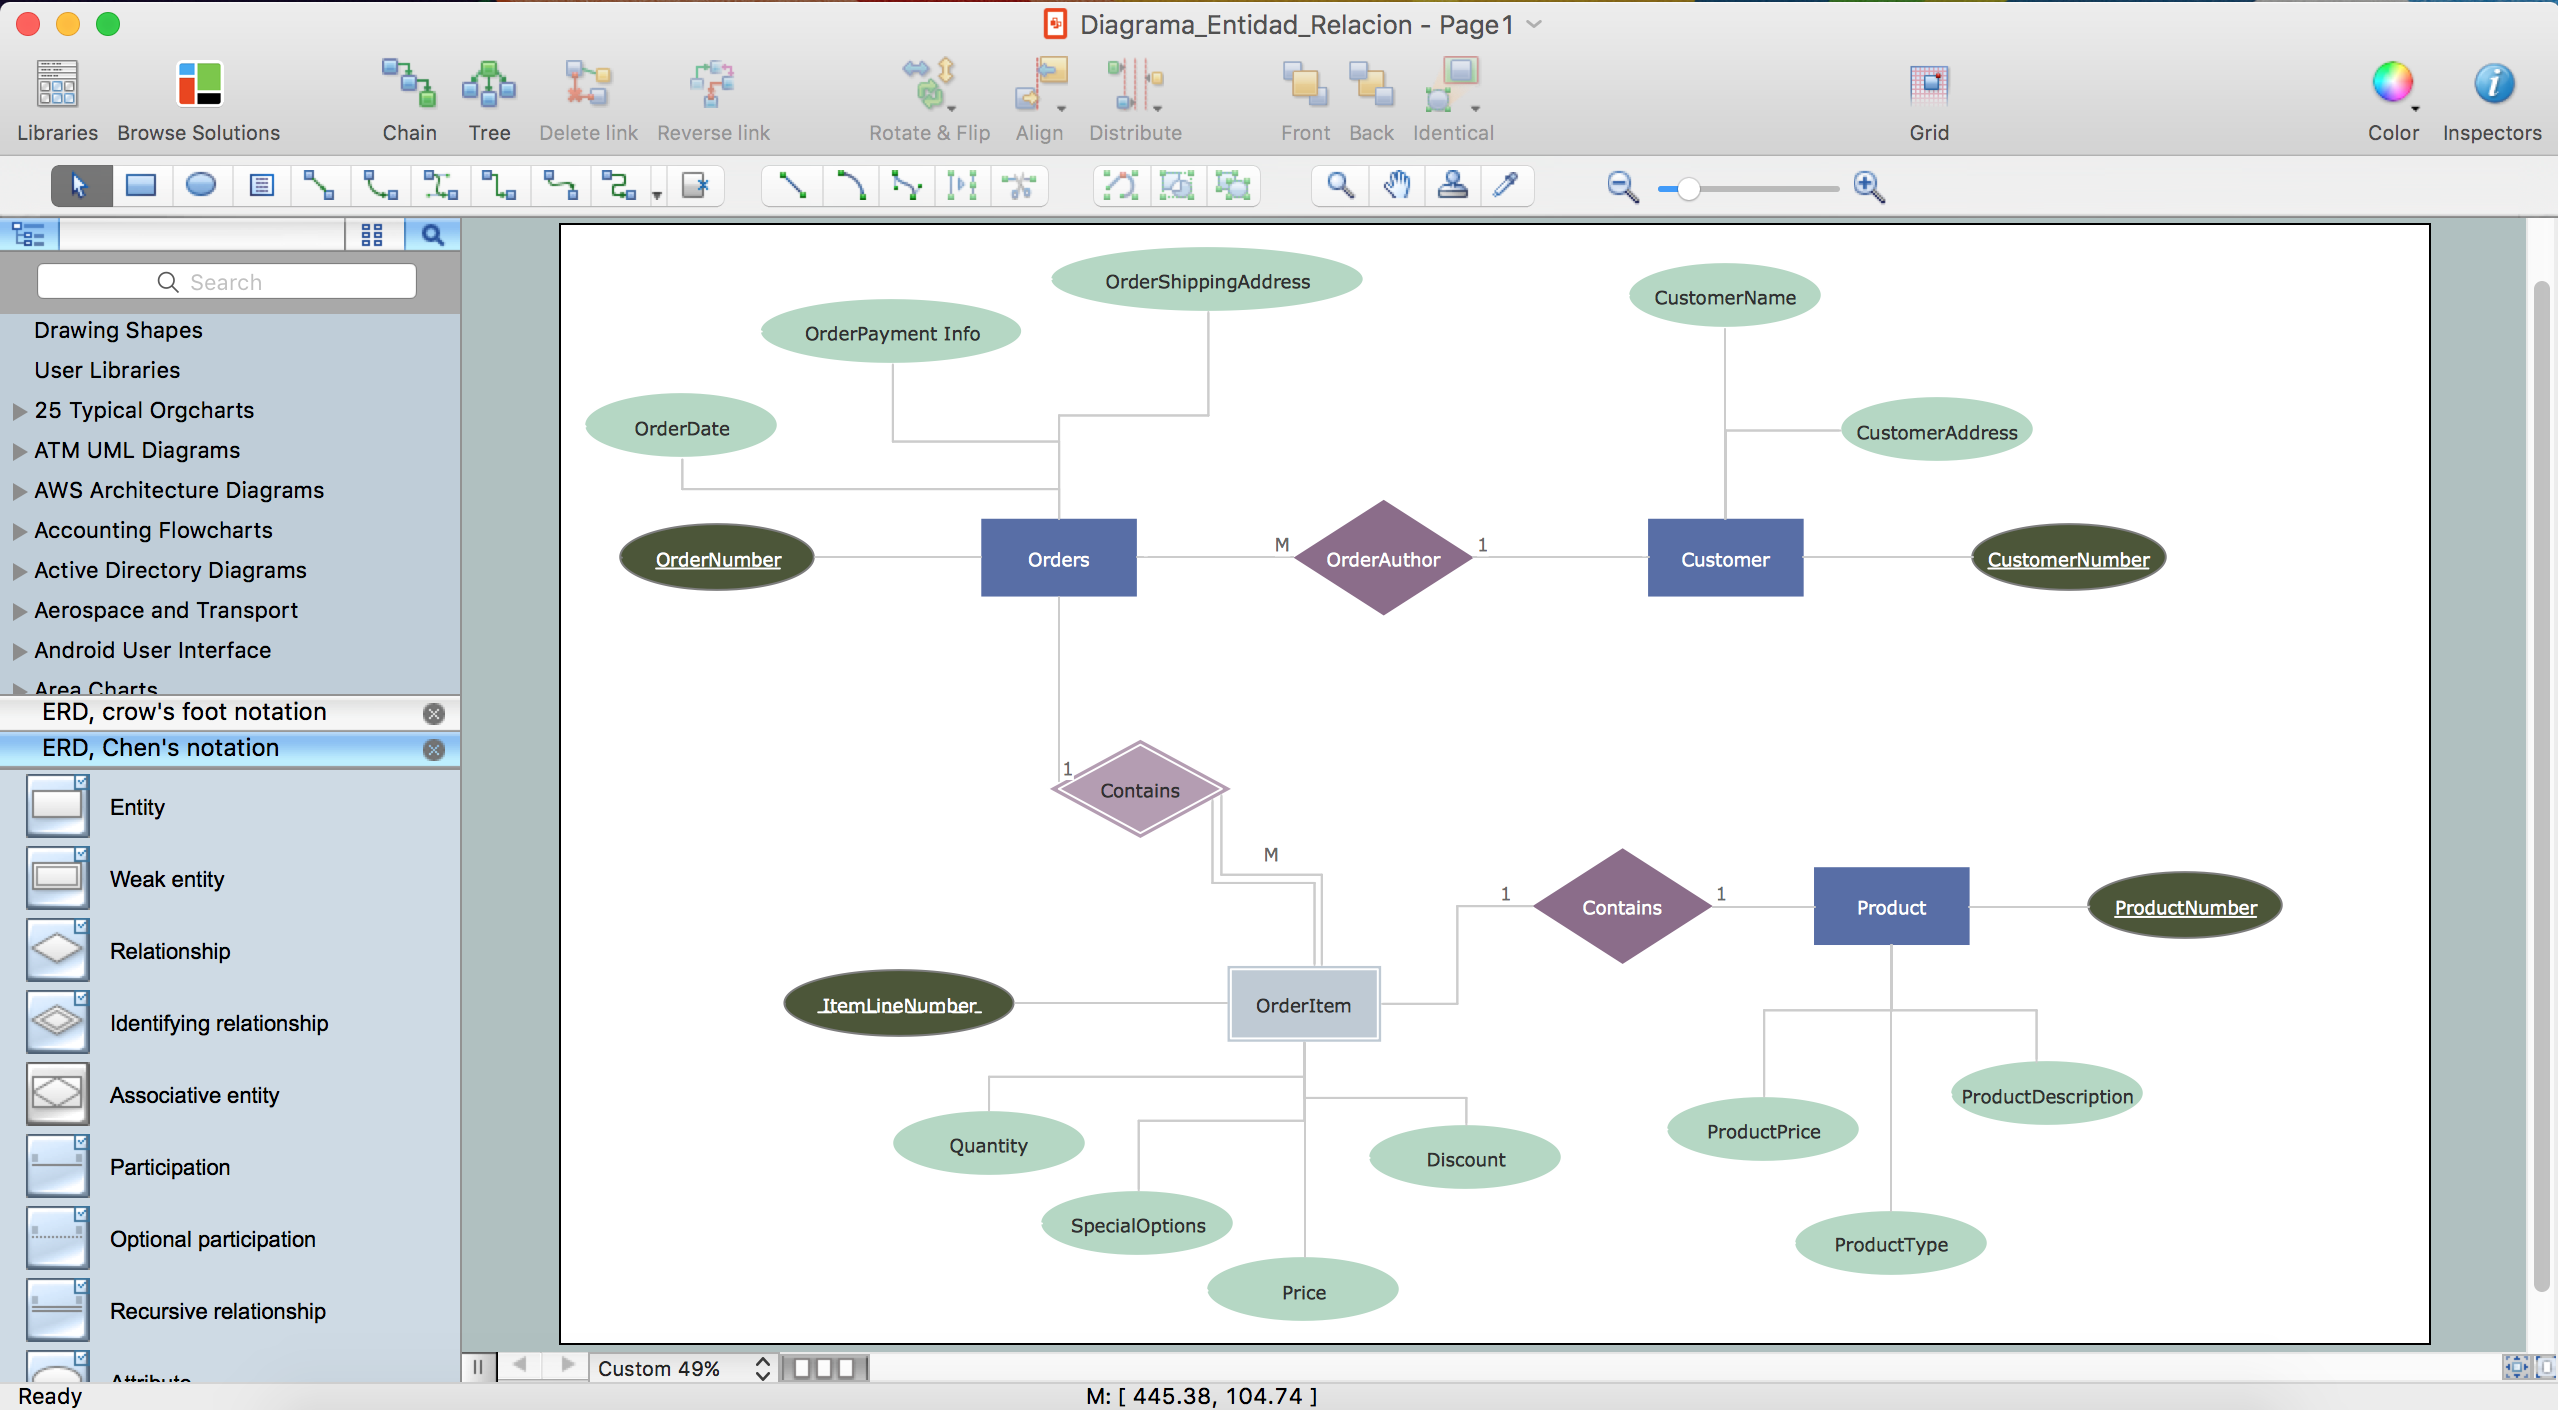
Picture: ER diagram tool for OS X
Related Solution:
There are numerous articles about the advantages of flowcharting, creating business graphics and developing different charts. Nevertheless, these articles are almost useless without the main component - the examples of flowcharts, org charts and without a fine example, it is difficult to get all the conveniences of creating diagrams. You can find tons of templates and vivid examples on Solution Park.
This illustration shows a variety of business diagrams that can be created using ConceptDraw DIAGRAM. It comprises a different fields of business activities: management, marketing, networking, software and database development along with design of infographics and business illustrations. ConceptDraw DIAGRAM provides a huge set of sample drawings including business process modeling diagrams,, network diagrams, UML diagrams, orgcharts, DFD, flowcharts, ERD, geographical maps and more.
Picture: Examples of Flowcharts, Org Charts and More
Related Solution:
When you are a beginner in software development, you make a lot of mistakes. Developing logical models, or data flow diagrams is a way to see the the whole project and all the processes clearly. And some novices, unfortunately for them, miss modeling stage at the beginning of project life cycle, and get into troubles as the project grows.
This image represents the data flow diagram applying symbols of Yourdon and Coad notation. This DFD depicts the data flow inside an organization department deals with receivables. The icons of standard Yourdon and Coad notation provides possibility to draw professional looking and well- readable DFD for business documentation. This data flow diagram was designed with the help of ConceptDraw DIAGRAM and its Data Flow Diagrams solution. The solution delivers three vector graphic libraries including elements of Yourdon and Coad and Gane-Sarson notations.
Picture: Data Flow Diagram Process
Related Solution:
Business Process Flow Diagram is a graphical presentation of business processes and process flows. It is one of the main tool of business analysis and business process re-engineering that lets identify and easy understand process flows within organization.
ConceptDraw DIAGRAM extended with Business Process Workflow Diagrams solution from the Business Processes area of ConceptDraw Solution Park is a powerful software which lets easy design Business Process Flow Diagram of any complexity.
Picture: Business Process Flow Diagram
Related Solution: