How to Create a Pie Chart
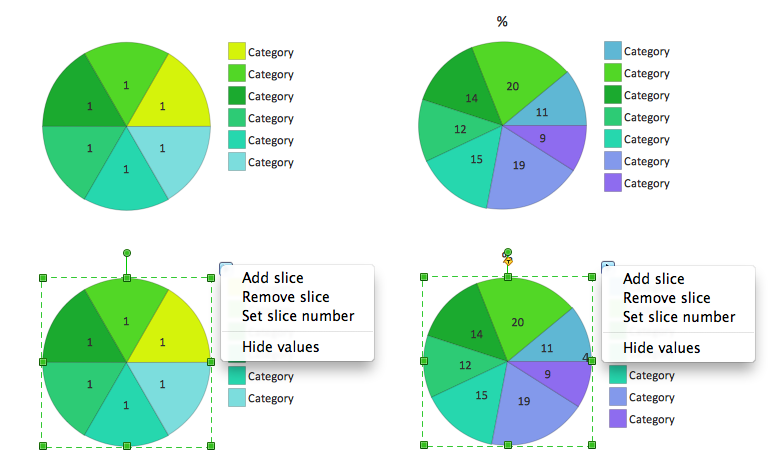
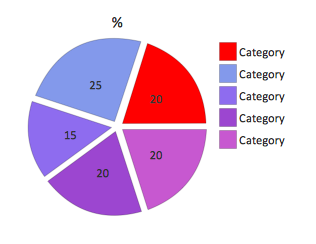
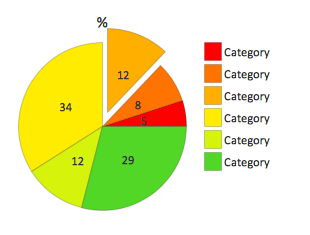
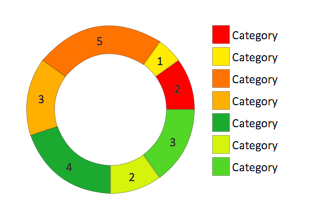
Pie chart and Percentage pie chart shapes.
- Drag and drop Pie chart or Percentage pie chart shape from the library to your document.
- Select the shape by mouse click. The Action menu triangle icon appears.
- Click on the triangle icon to open Action menu.
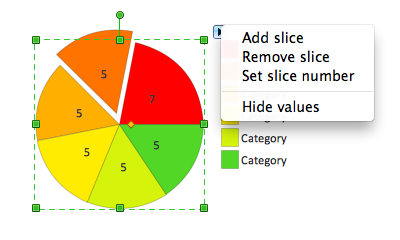
- To change slice number use Action menu commands Add slice, Remove slice, Set slice number.
- To hide or show values in the slices use Action menu command Hide/Show values.
- To change value in a slice select chart, then select slice and type new value.
- To add or change chart caption select pie chart and simply start typing.
- To set category names select pie chart, then select legend, and then select a category and start typing.
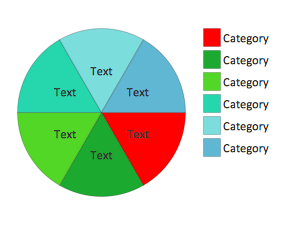
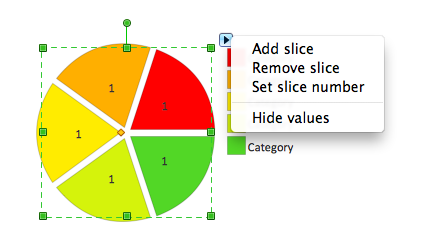
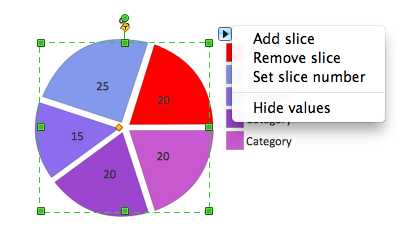
Pie chart, control dots shape.
- Drag and drop Pie chart, control dots shape from the library to your document.
-
Select the shape by mouse click. The Action menu triangle icon appears.
- Click on the triangle icon to open Action menu.
- To change slice number use Action menu commands Add slice, Remove slice, Set slice number.
- To hide or show labels in the slices use Action menu command Hide/Show labels.
- To change label in a slice select the pie chart, then select slice and type new label.
- To change anglular size of the slices select the pie chart and use control dots.
- To equalize anglular sizes of the slices use Action menu command equalize slices.
- To add or change chart caption select the pie chart and simply start typing.
- To set category names select the pie chart, then select legend, and then select a category and start typing.
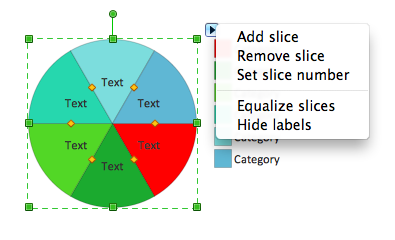
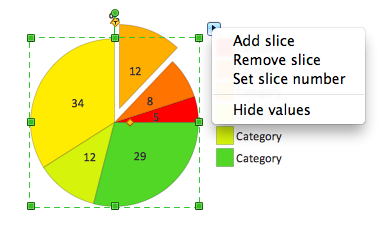
Separated pie chart and Percentage separated pie chart shapes.
- Drag and drop Separated pie chart or Percentage separated pie chart shape from the library to your document.
- Select the shape by mouse click. The Action menu triangle icon appears.
- Click on the triangle icon to open Action menu.
- To change slice number use Action menu commands Add slice, Remove slice, Set slice number.
- To hide or show values in the slices use Action menu command Hide/Show values.
- To change value in a slice select the pie chart, then select slice and type new value.
- To add or change chart caption select the pie chart and simply start typing.
- To set category names select the pie chart, then select legend, and then select a category and start typing.
 |
 |  |
 |
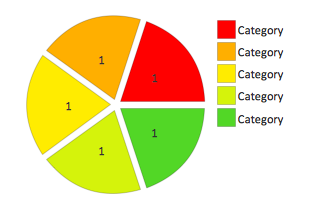
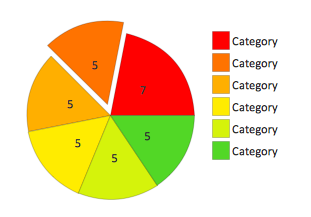
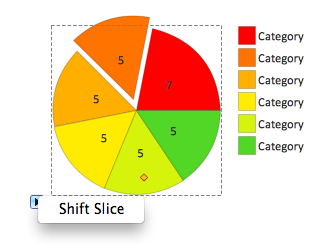
Pie chart with shifted slices and Percentage pie chart with shifted slices shapes.
- Drag and drop Pie chart with shifted slices or Percentage pie chart with shifted slices shape from the library to your document.
- Select the shape by mouse click. The Action menu triangle icon appears.
- Click on the triangle icon to open the Action menu.
- To change slice number use Action menu commands Add slice, Remove slice, Set slice number.
- To hide or show values in the slices use Action menu command Hide/Show values.
- Click on the triangle icon to open the Action menu.
- To change value in a slice select the chart, then select slice and type new value.
- To shift or fix a slice select the pie chart, then select the slice, click on Action menu icon, then use command Shift/Fix slice.
- To add or change chart caption select the pie chart and simply start typing.
- To set category names select the pie chart, then select legend, and then select a category and start typing.
 |
 |
 |
 |
 |
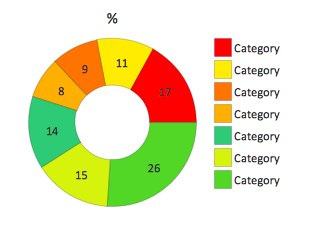
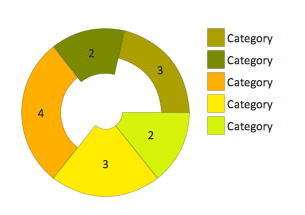
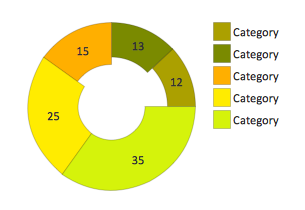
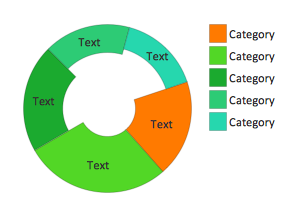
Ring chart and Percentage ring chart shapes.
- Ring chart also known as donut or doughnut chart.
- Drag and drop Ring chart or Percentage ring chart shape from the library to your document.
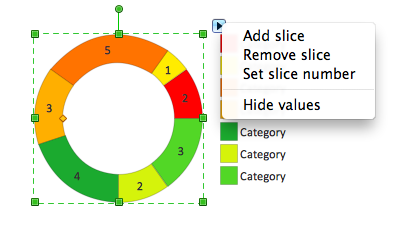
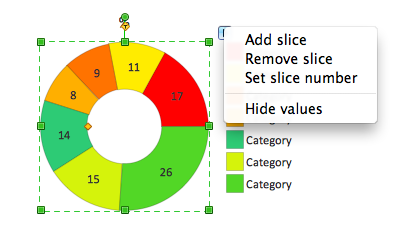
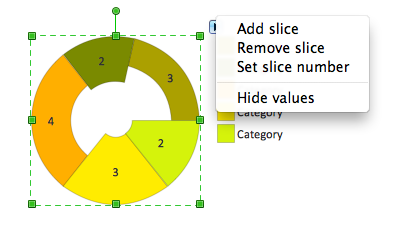
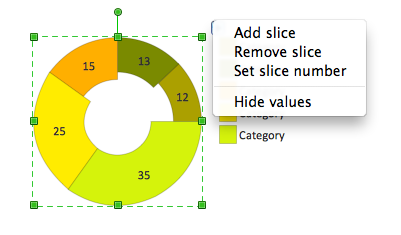
- Select the shape by mouse click. The Action menu triangle icon appears.
- Click on the triangle icon to open the Action menu.
- To change slice number use Action menu commands Add slice, Remove slice, Set slice number.
- To hide or show values in the slices use Action menu command Hide/Show values.
- Click on the triangle icon to open the Action menu.
- To change value in a slice select the chart, then select slice and type new value.
- To change ring thickness (hole size) select the chart, then move control dot.
- To add or change chart caption select the chart and simply start typing.
- To set category names select the chart, then select legend, and then select a category and start typing.
 |
 |
 |
 |
Ring chart 2 and Percentage ring chart 2 shapes.
- Drag and drop Ring chart 2 or Percentage ring chart 2 shape from the library to your document.
- Select the shape by mouse click. The Action menu triangle icon appears.
- Click on the triangle icon to open the Action menu.
- To change slice number use Action menu commands Add slice, Remove slice, Set slice number.
- To hide or show values in the slices use Action menu command Hide/Show values.
- To change value in a slice select the chart, then select slice and type new value.
- To change thickness of selected sector, select the chart, then select a sector and move control dot.
- To add or change chart caption select the chart and simply start typing.
- To set category names select the chart, then select legend, and then select a category and start typing.
 |
 |
 |
 |
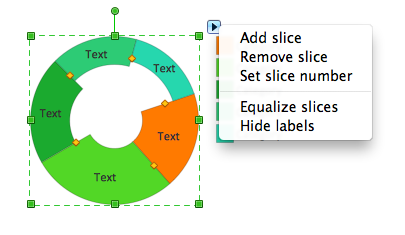
Ring chart, control dots shape.
- Drag and drop Ring chart, control dots shape from the library to your document.
- Select the shape by mouse click. The Action menu triangle icon appears.
- Click on the triangle icon to open the Action menu.
- To change slice number use Action menu commands Add slice, Remove slice, Set slice number.
- To hide or show labels in the slices use Action menu command Hide/Show labels.
- To change label in a slice select the chart, then select slice and type new label.
- To change anglular size of the slices select the chart and use control dots.
- To equalize anglular sizes of the slices use Action menu command equalize slices.
- To change thickness of selected sector, select the chart, then select a sector and move control dot.
- To add or change chart caption select the chart and simply start typing.
- To set category names select the chart, then select legend, and then select a category and start typing.
Arrow ring chart and Percentage arrow ring chart shapes.
- Drag and drop Ring chart or Percentage ring chart shape from the library to your document.
- Select the shape by mouse click. The Action menu triangle icon appears.
- Click on the triangle icon to open the Action menu.
- To change slice number use Action menu commands Add slice, Remove slice, Set slice number.
- To hide or show values in the slices use Action menu command Hide/Show values.
- To change value in a slice select the chart, then select slice and type new value.
- To change ring thickness (hole size) select the chart, then move control dot.
- To add or change chart caption select the chart and simply start typing.
- To set category names select the chart, then select legend, and then select a category and start typing.
Free Download Pie Chart Software and View All Examples

Example 1. Pie chart example. Donut chart — Budgeted appropriations.
See Also:
- How to Create a Bar Chart
- How to Create a Line Chart
- How to Create a Pyramid Chart
- How to Create a Scatter Chart
- How to Create a Column Chart
TEN RELATED HOW TO's:
This sample was created in ConceptDraw DIAGRAM diagramming and vector drawing software using the UML Use Case Diagram library of the Rapid UML Solution from the Software Development area of ConceptDraw Solution Park.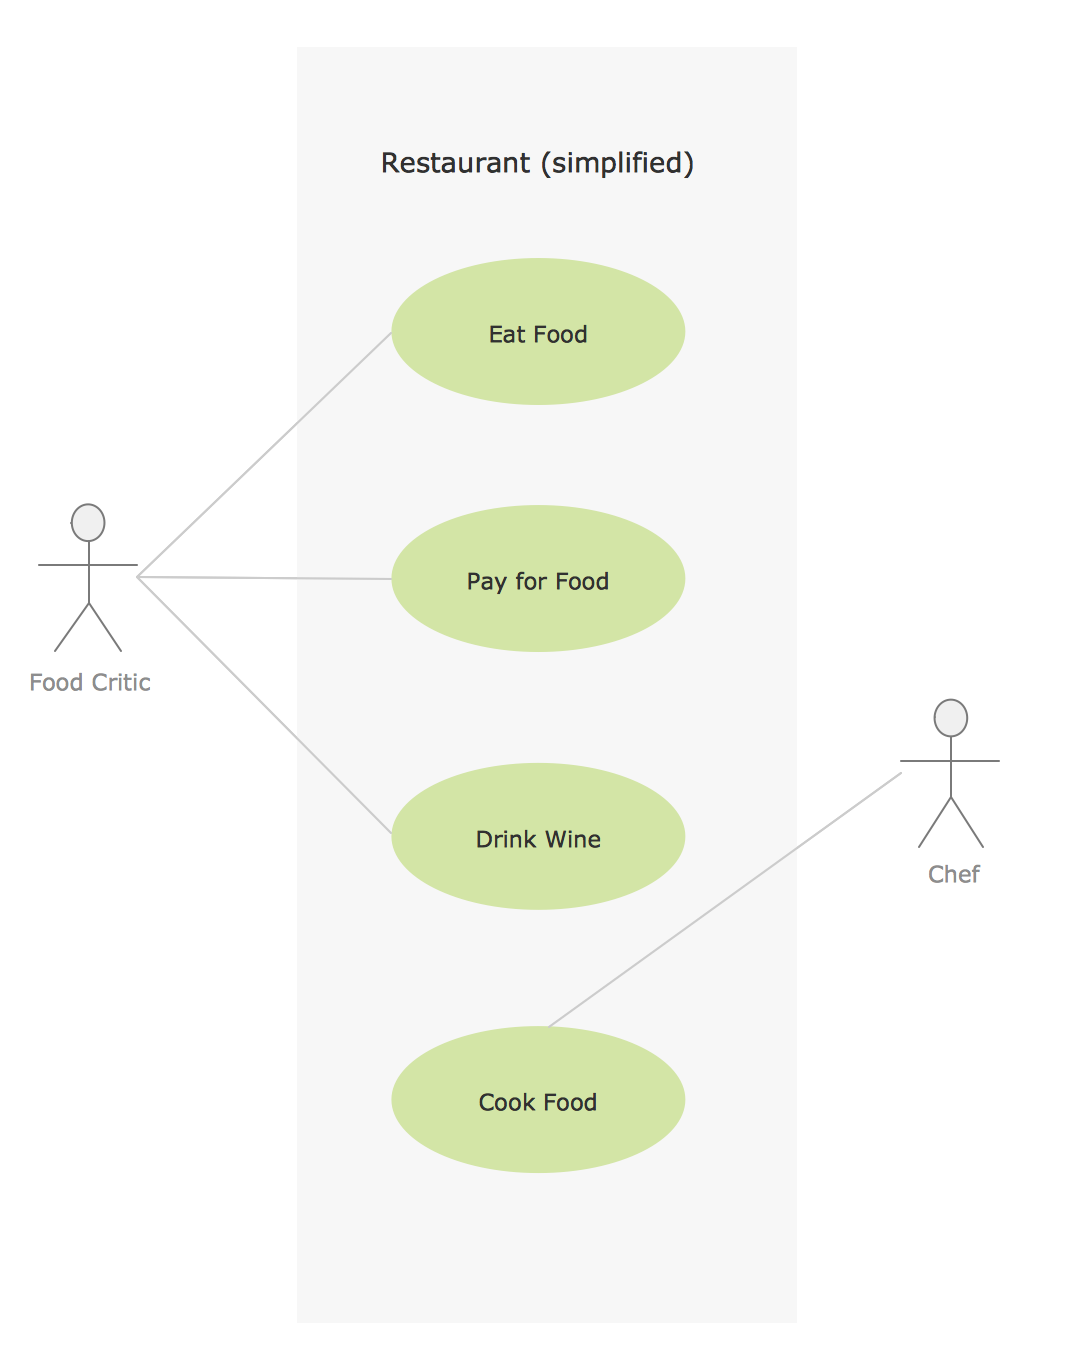
Picture: Sample for UML
Related Solution:
Big and complex projects sometimes need some simplification of plans and schedules. That's why Program Evaluation and Review Technique was invented and first implemented in 1958. You can create PERT diagrams effortlessly with ConceptDraw DIAGRAM and share them with your colleagues.
Program Evaluation Review Technique (PERT) is a method that is used to assess and analyze projects. PERT is a valuable tool for the project management practice. PERT gives an assessment and analysis of the time needed to the project completion. A PERT chart is a visual tool that delivers a graphical view of a project timeline. It is used to display the sequences and dependences of project tasks necessary to complete a project. ConceptDraw DIAGRAM delivers the possibility to build a PERT along with other diagrams applied to assist management process by using its Seven Management and Planning Tools solution.
Picture: Program Evaluation and Review Technique (PERT) with ConceptDraw DIAGRAM
Related Solution:
ConceptDraw Column Chart software allows drawing column charts using predesigned objects or drawing tools. In ConceptDraw Column Chart software you can find a complete set of column chart tools and objects.
Picture: Column Chart Software
Related Solution:
Column chart examples from ConceptDraw collection can help you find the best visual depiction for you data. You can easily modify column chart examples according to data you want to visualize.
Picture: Column Chart Examples
Related Solution:
ConceptDraw Pyramid Diagram software allows drawing column charts using predesigned objects or drawing tool.
Picture: Fundraising Pyramid
Related Solutions:
Microsoft Azure is widely used cloud platform which was created by Microsoft and now is managed by Microsoft datacenters in 19 regions of the world, and has a wide set of benefits and features.
ConceptDraw DIAGRAM diagramming and vector drawing software extended with Azure Architecture Solution from the Computer and Networks area of ConceptDraw Solution Park is the best for designing various pictorial infographics, illustrations and materials showing the possibilities and work of Microsoft Azure Cloud System and Azure services.
Picture: Microsoft Azure
Related Solution:
If you want to find a way to understand complex things in minutes, you should try to visualize data. One of the most useful tool for this is creating a flowchart, which is a diagram representing stages of some process in sequential order. There are so many possible uses of flowcharts and you can find tons of flow charts examples and predesigned templates on the Internet. Warehouse flowchart is often used for describing workflow and business process mapping. Using your imagination, you can simplify your job or daily routine with flowcharts.
Warehouse flowcharts are used to document product and information flow between sources of supply and consumers. The flowchart provides the staged guidance on how to manage each aspect of warehousing and describes such aspects as receiving of supplies; control of quality; shipment and storage and corresponding document flow. Warehouse flowchart, being actual is a good source of information. It indicates the stepwise way to complete the warehouse and inventory management process flow. Also it can be very useful for an inventory and audit procedures.
Picture: Flow chart Example. Warehouse Flowchart
Related Solution:
Create flowcharts, org charts, floor plans, business diagrams and more with ConceptDraw DIAGRAM.
Picture: Simple Diagramming
Related Solution:
ConceptDraw
DIAGRAM 17