Create Fishbone Diagrams with the ConceptDraw
ConceptDraw DIAGRAM has the powerful tools for rapid drawing Fishbone diagrams and identifying many possible causes for an effect for problem solving. Causes can be grouped into major categories to identify these sources of variation. Fishbone diagram shows factors of Equipment, Process, People, Materials, Environment and Management, all affecting the overall problem in one drawing for the further analysis. Easy create Fishbone diagrams with the ConceptDraw PRO software and Fishbone Diagrams solution included to ConceptDraw Solution Park!

Example 1. Create Fishbone Diagrams with the ConceptDraw
If you dream to design the Fishbone Diagrams quick and easy, and need a powerful software to do this, the ConceptDraw DIAGRAM is the best choice for you. Fishbone Diagrams Solution extends ConceptDraw DIAGRAM with large collection of ready Fishbone Diagram templates for quick start. All they are available from ConceptDraw STORE, you can choose any that meets your requirements and design your chart on its base.

Example 2. Fishbone Diagrams Solution in ConceptDraw STORE
Another convenient way to create Fishbone Diagrams with the ConceptDraw is to design it from the beginning at new ConceptDraw document using the predesigned objects from the Fishbone Diagrams library. Simply drag desired vector objects and arrange them, add the text, make some stylish changes, and your professional-looking Cause and Effect Diagram or Fishbone Diagram will be ready.

Example 3. Template - Fishbone 8 Ps
The sample and template you see on this page were created in ConceptDraw DIAGRAM using the Fishbone Diagrams Solution. An experienced user spent 10 minutes creating each of them.
Use the tools of Fishbone Diagrams Solution to create Fishbone Diagrams with the ConceptDraw quick, easy and effective.
All source documents are vector graphic documents. They are available for reviewing, modifying, or converting to a variety of formats (PDF file, MS PowerPoint, MS Visio, and many other graphic formats) from the ConceptDraw STORE. The Fishbone Diagrams Solution is available for all ConceptDraw DIAGRAM or later users.
EIGHT RELATED HOW TO's:
It is important to have an electrical circuits scheme, when you plan a renovation or move to a new apartment. You have to arrange interior according to that plan, and it’s trouble-free to create wiring diagrams with ConceptDraw DIAGRAM , furthermore, this software has all the features needed to create an interior plan as well. So, get inspired by tons of examples included to ConceptDraw DIAGRAM solutions, and start your diagramming experience!
A wiring diagrams, that are represented on this drawing was created to depict the components of the electrical circuit schemes. These diagrams are created to depict the information about circuit arrangements and connections. Wiring diagrams, in contrast to physical drawings, use standard symbol's notation to depict different circuit devices and connections. That is why, wiring diagrams are applied to discover and repair electrical and electronic circuits. The vector graphic objects provided by ConceptDraw Electrical Engineering solution can help any specialist in electric engineering to design electrical schemes, circuit and wiring plans, power systems charts, and Maintenance and Repair diagrams.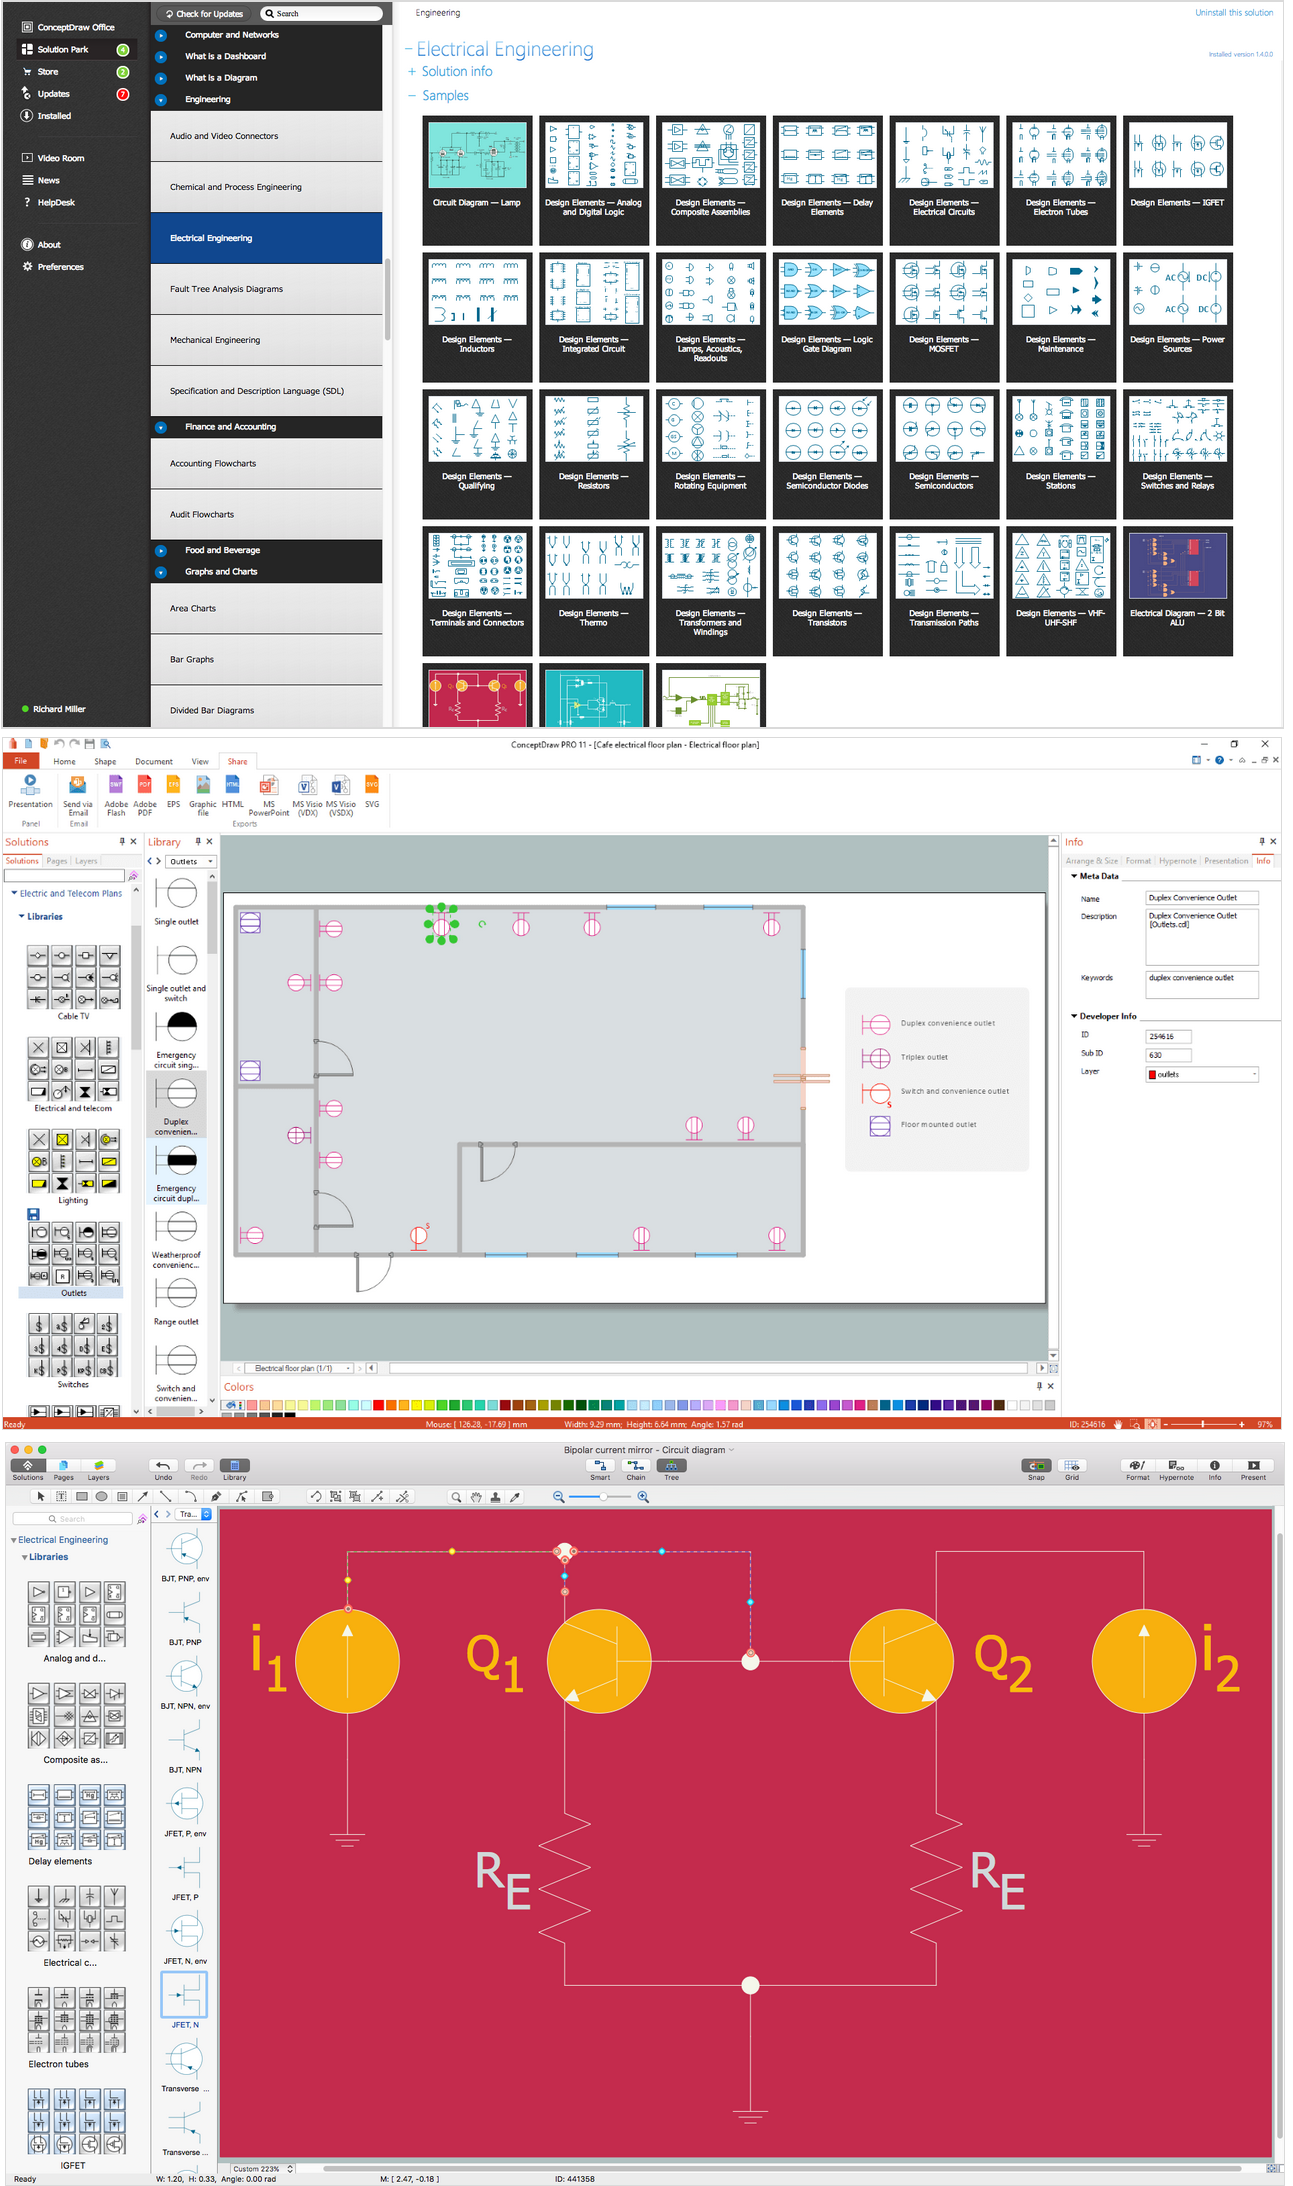
Picture: Wiring Diagrams with ConceptDraw DIAGRAM
Related Solution:
When searching for a diagramming tool, we look for a powerful and reliable software that would be easy to use. To mention one, ConceptDraw DIAGRAM has all the necessary features to create cross-functional flowcharts (Swim Lanes) quick and effortlessly. You can draw swim lane diagrams in both vertical and horizontal ways.
This cross-functional flowchart displays a payroll process. It explains to each participant his role in the process depending on the category, represented with swimlanes. Using this flowchart, every employee can easily find out what he can expect in terms of salary. Generally a cross-functional diagram enables one to take a look at processes with a wider scope and with more precision than simple flowchart. Business process capturing using cross-functional flowcharts can be useful for stakeholders and managers to define clearly the staff's roles and responsibilities.
Picture: Cross-Functional Flowchart (Swim Lanes)
Related Solution:
Installing a wireless network is not very different from a regular network. After you configure the interfaces, the half of network configuration is done. You should also set routing, masquerading and set all the addresses.
This Interactive Voice Response Diagram (IVR) diagram depicts topology of an IVR system and shows physical and logical structure of an IVR system. It is created using facilities of the ConceptDraw solutions: Computer and Networks Diagrams in conjunction with Interactive Voice Response Diagrams. The diagram helps to understand how the call-center's equipment interacts with customer's calls to route them in the proper manner enabling client to get a useful response.
Picture: Network Configuration
Related Solution:
Stakeholders are the groups of people or organizations whose contribution matters to the organization's success, this can be labour participation, financial participation, dissemination of information about organization, etc. So, the employees of the company, its suppliers, customers, media, public organizations, state authorities, all they are stakeholders of the company.
ConceptDraw DIAGRAM diagramming and vector drawing software extended with Stakeholder Onion Diagrams Solution from the Management Area of ConceptDraw Solution Park is a powerful stakeholder mapping tool which allows easy create Stakeholder Onion diagrams and maps depicting the layers of a project, relationships of stakeholders to a project goal, and relationships between stakeholders.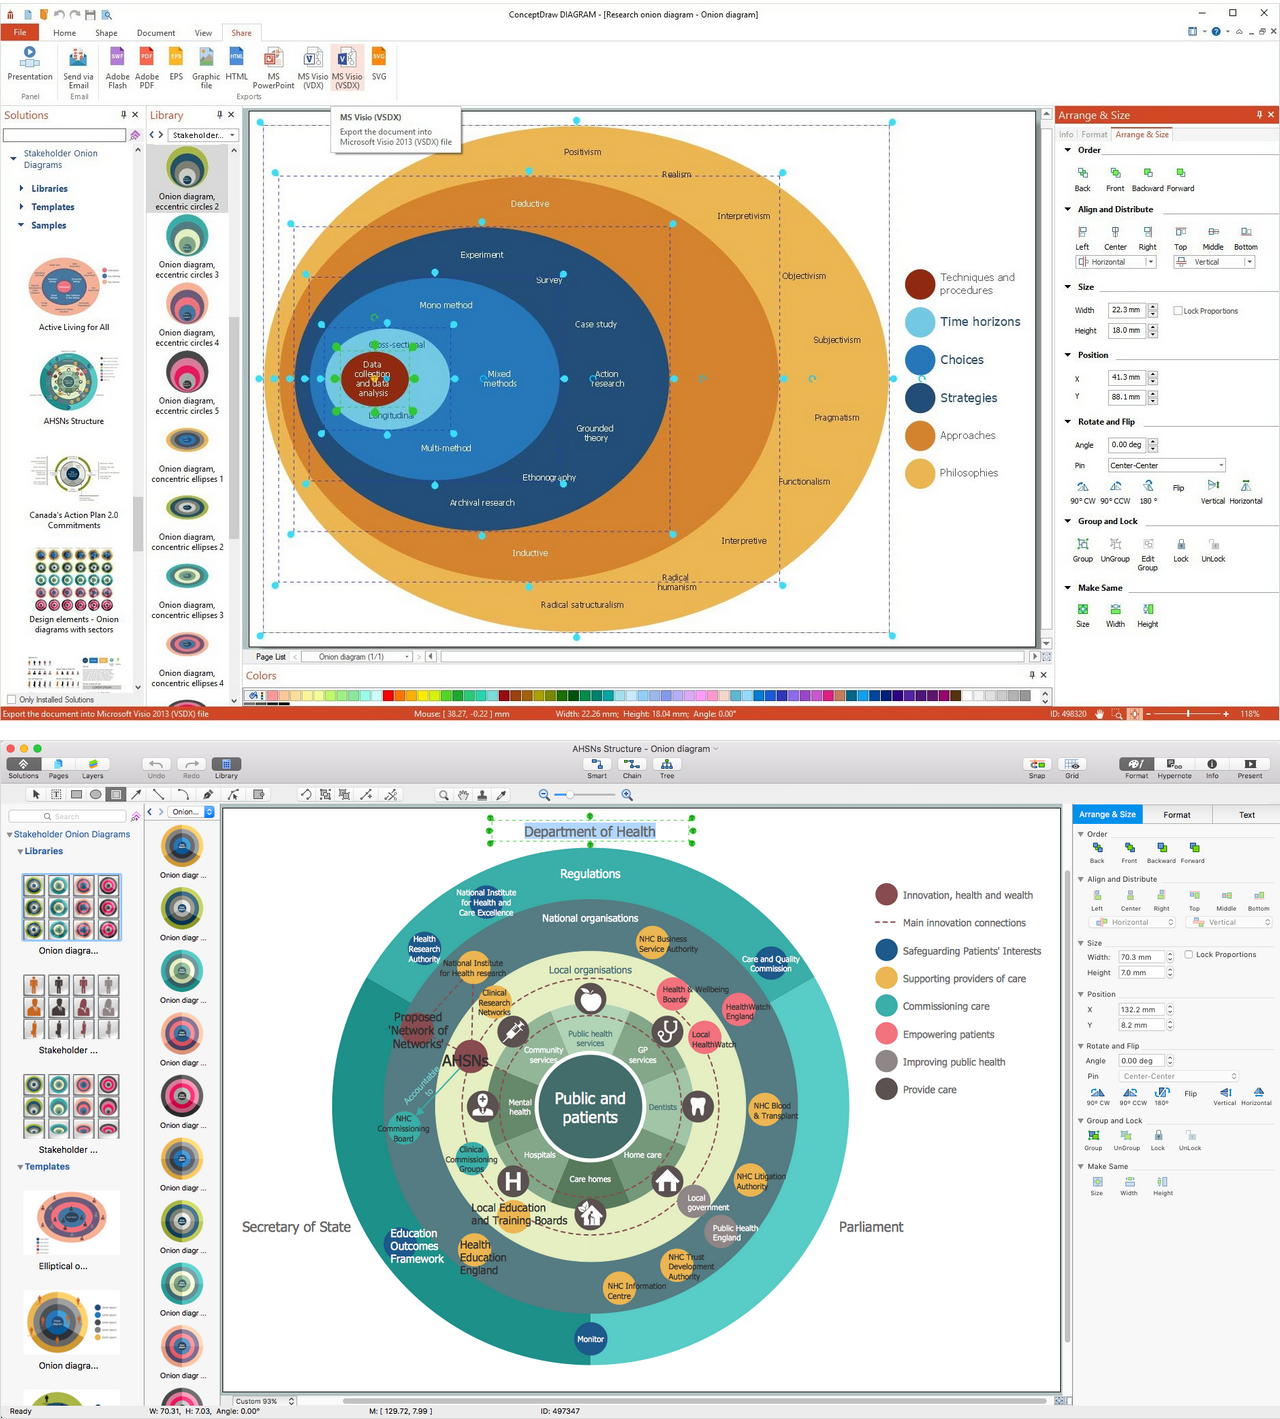
Picture: Onion Diagram as Stakeholder Mapping Tool
Related Solution:
ConceptDraw DIAGRAM diagramming and vector drawing software extended with Fishbone Diagrams solution is a perfect tool for software designers and software developers. If you need to create Cause and Effect diagram, Fishbone diagram, Ishikawa diagram from templates and examples, or using the predesigned elements, ConceptDraw DIAGRAM can do this easily.
ConceptDraw DIAGRAM software gives ability to design Fishbone diagrams that identify many possible causes for an effect for problem. Each Fishbone diagram design element included to Fishbone Diagrams library is vector and ready-to-use..png)
Picture: Fishbone Diagram Design Element
Related Solution:

