Chemistry Equation Symbols
Chemistry is a complex science that studies the composition, structure, properties and changes of matter. It studies how atoms and molecules interact each other, and also different reactions and transformations that occur at this.
If you are related with chemistry in you work or education activity, you need often draw various illustrations with chemistry equations. ConceptDraw DIAGRAM diagramming and vector drawing software offers you the Chemistry solution from the Science and Education area.

Sample 1. Chemistry Solution – Carbonyl Compound Halogenation Mechanism
Chemistry Solution provides the Chemical Drawings Library with large quantity of vector chemistry equation symbols to help you create professional looking chemistry diagrams quick and easy.

Sample 2. Chemistry equation symbols – Chemical Drawings Library Design Elements
Use of these predesigned chemistry equation symbols lets you the possibility to draw any chemistry equation. Simply drag the needed objects from the library to the document and arrange them. Use your chemical drawings created in ConceptDraw DIAGRAM in your education, scientific, and any other activity. They will always have a success and you can easily explain your thoughts to the colleagues.

Sample 3. Chemistry Solution – Chemistry Phenols
This sample was created in ConceptDraw DIAGRAM using the chemistry equation symbols from the Chemistry Solution. It shows the scheme of phenols and reactions dependent on their participation. An experienced user spent 20 minutes creating this sample.
The chemical drawings and schemes designed with ConceptDraw DIAGRAM are vector graphic documents and are available for reviewing, modifying, converting to a variety of formats (image, HTML, PDF file, MS PowerPoint Presentation, Adobe Flash or MS Visio), printing and send via e-mail in one moment.
TEN RELATED HOW TO's:
A technical drawing of a building is called an architectural drawing. According to a set of conventions, a building drawing includes a number of views, as well as unit measurements, scales, sheet sizes, cross referencing and annotation. Computer progress had a major impact of the methods of architectural drawing, making manual drawing almost obsolete. Digital drawing software, such as ConceptDraw DIAGRAM , offers a number of tools for each design element: piping plan, floor plan, etc.
Any building should have its plumbing and piping plans for every room, that has a water supply. Plans are applied to indicate arrangement of piping system in the building. This diagram presents a suite of standard piping icons for making building plans that include plumbing and piping layout. This diagram was designed using ConceptDraw solution for Piping and Plumbing planning. Using symbols is valuable for making a valid piping plan. Because any professional will properly interpreted such plan as a piece of technical documentation of a construction project.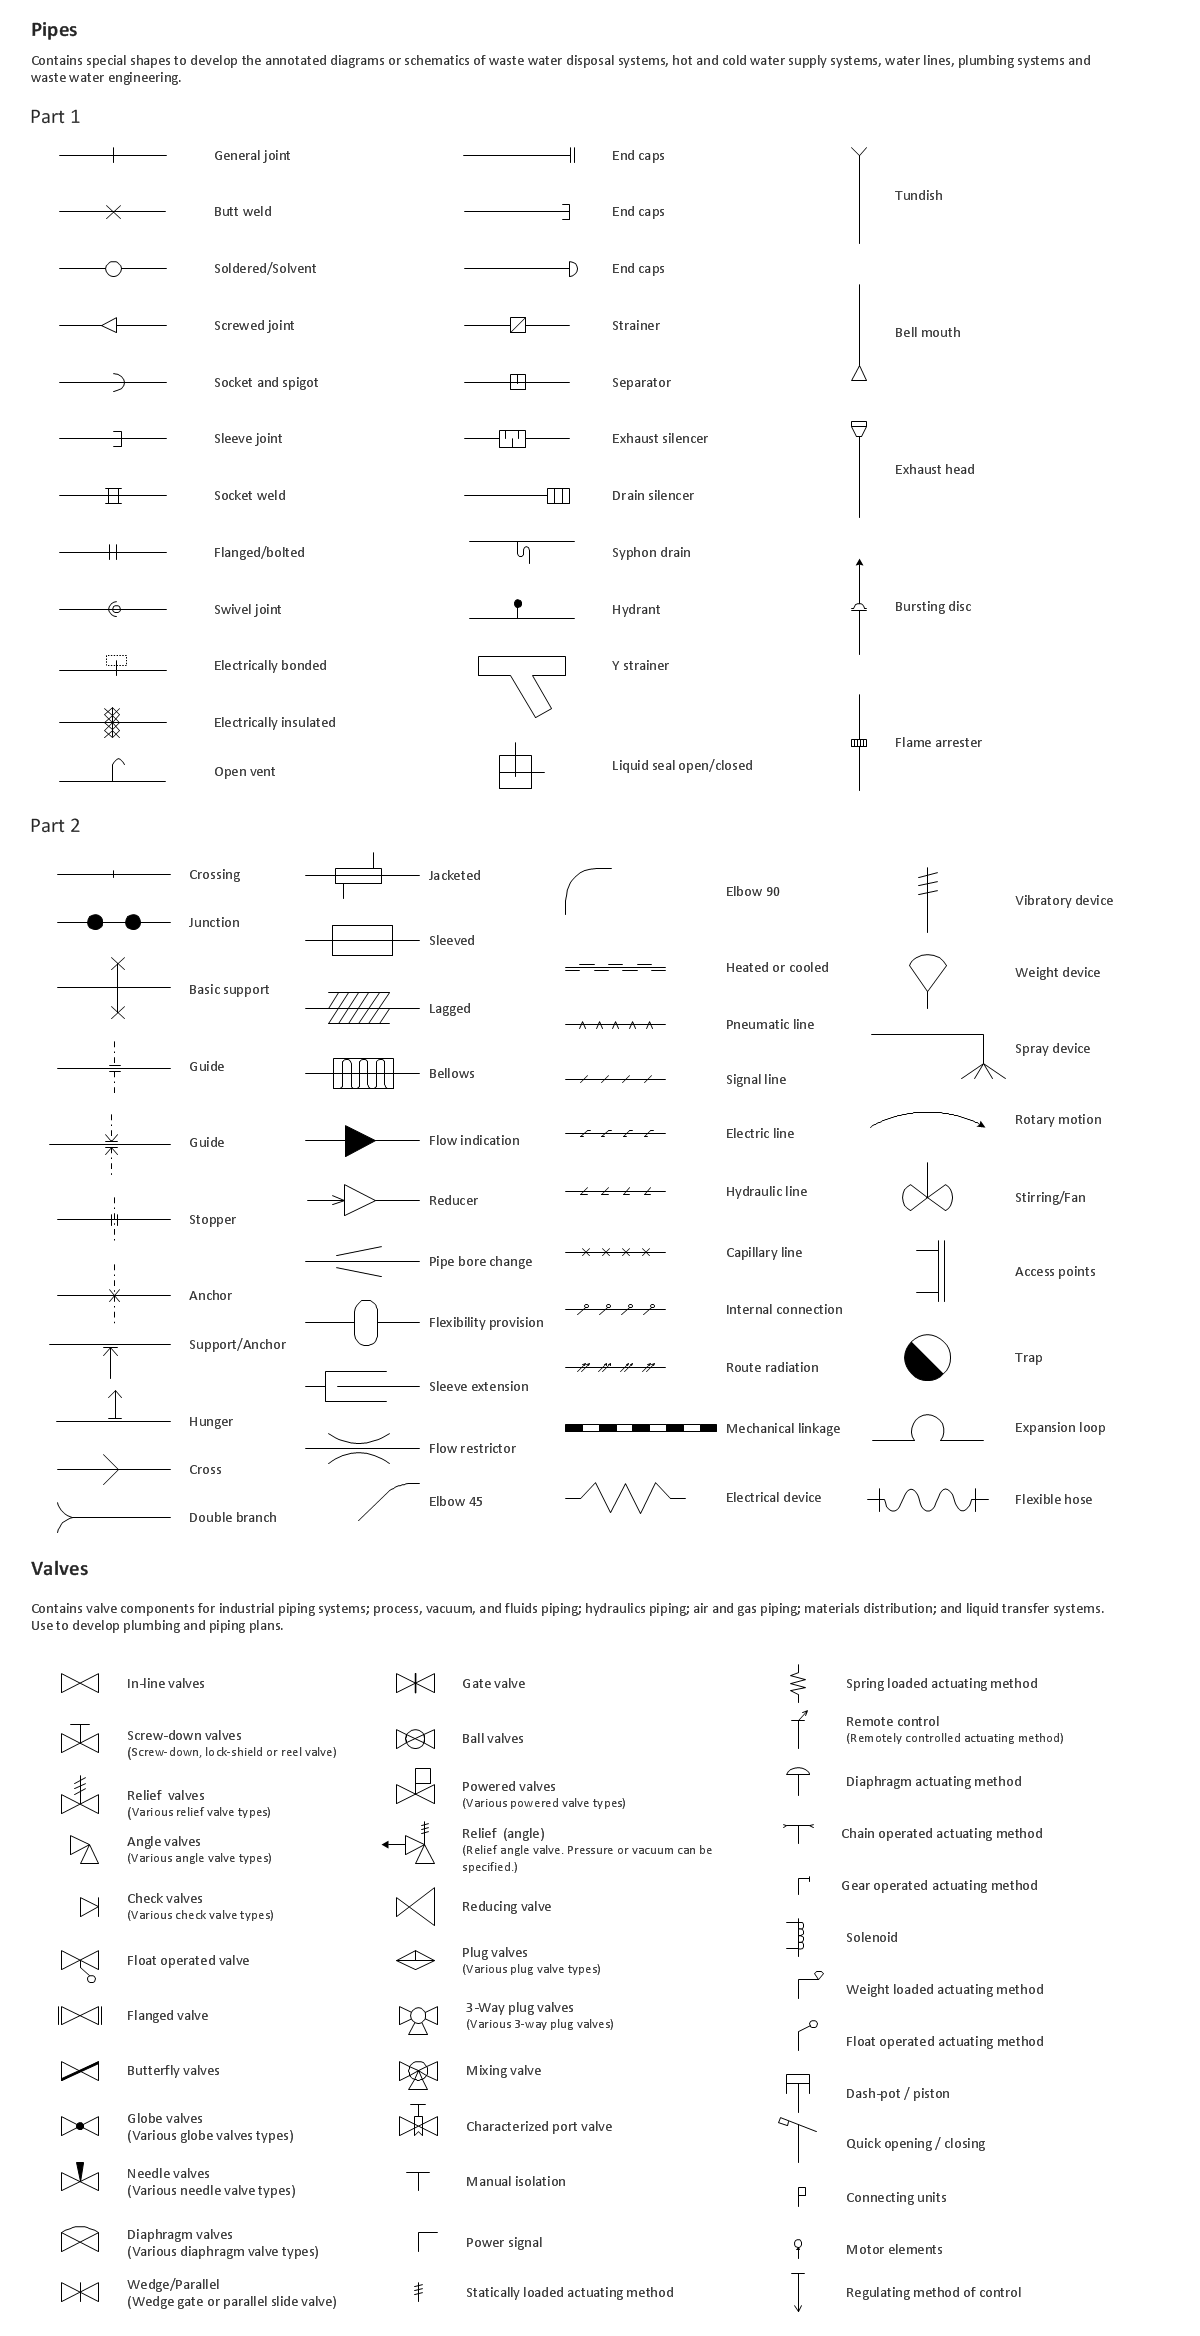
Picture: Building Drawing. Design Element: Piping Plan
Related Solution:
A list of parameters on which networks differ is very long. A large network with a range up to 50 kilometers is called metropolitan area network (MAN), and this type of network can include several local area networks. Metropolitan networks in their turn connect into global area networks.
Here you will see a Metropolitan Area Network (MAN). This is an extensive network which occupies a large territory including a few buildings or even the whole city. The space of the MAN is bigger than LAN, but lower than WAN. MAN comprise a lot of communication equipment and delivers the Internet connection to the LANs in the city area. Computer and Networks solution for ConceptDraw DIAGRAM provides a set of libraries with ready-to-use vector objects to design various kinds of computer networks.
Picture: Metropolitan area networks (MAN). Computer and Network Examples
Related Solution:
Venn diagrams are illustrations used in the branch of mathematics known as set theory. They show the mathematical or logical relationship between different groups of things (sets). A Venn diagram shows all the possible logical relations between the sets.
Picture: Venn Diagram Examples for Problem Solving.Venn Diagram as a Truth Table
Related Solution:
A competent delegation of responsibilities between workers guarantees business success in most cases. At first sight, it might seem that workflow diagram symbols are quite similar to a regular flowchart. But workflow diagram is a more accurate way to present working processes.
Workflow diagrams are helpful for a working process analyzation, to depict a pathway of process issues, personalize responsibilities and identify resources that will help to optimize a workflow. Generally, Workflow diagram deploys flowchart symbols for displaying work process steps and relationships. But, often it require some additions and improvements to become more professional and illustrative. The Workflow solution for ConceptDraw DIAGRAM provides the user with a big library of symbols that are designed especially for workflow diagrams.
Picture: Workflow Diagram Symbols
Related Solution:
Accounting is a cornerstone of any business, it’s basement. If you want to have a visual representation of your finance management, use audit flowchart symbols to document the money flow. Although some would say that accounting is boring, it is very a responsible duty.
The audit flowchart symbols is supplied with ConceptDraw Audit Flowcharts solution as a vector objects library. Together with Conceptdraw Drawing capabilities it forms the helpful tool for audit process planning and setting the steps of audit by designing audit flow charts. Audit Flow charts are used to organize fiscal information tracking process as well as in accounting, finance and investment management.
Picture: Audit Flowchart Symbols
Related Solution:
Project progress on web: delivering project status to remote teams and stakeholders via Skype.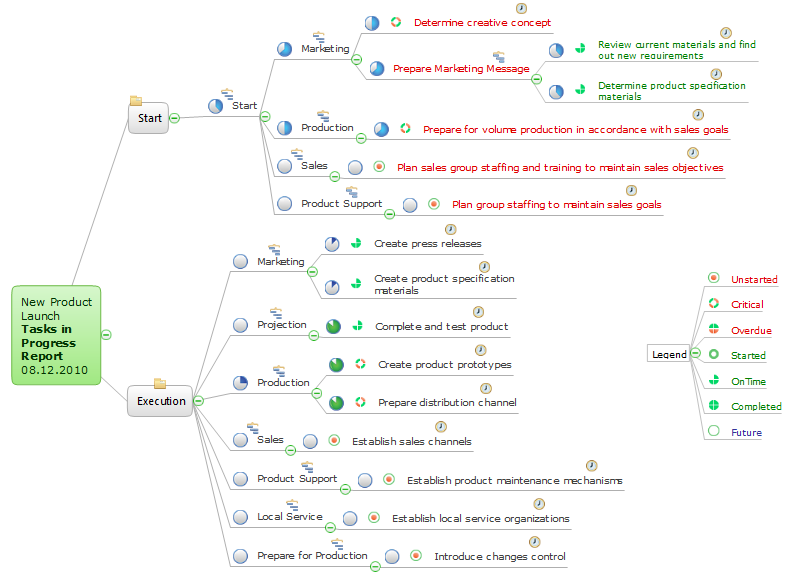
Picture: How To Show Project Progress Peport on Web
Related Solution:
Process Flow Charts are very popular and widely used in chemical and process engineering for representation a general flow of plant processes and equipment. If you need often draw them, the ConceptDraw DIAGRAM diagramming and vector drawing software extended with tools of Flowcharts Solution will be useful for you.
The mostly used set of process flow chart symbols includes the following: Rectangle (box) process flow chart symbol, Rounded rectangle, Circle, Diamond.
Picture: Process Flow Chart Symbol
Related Solution:
ConceptDraw DIAGRAM is a powerful intelligent vector graphics engine that can be used to create basic diagrams including flowcharts, charts, workflows, flowcharts, organizational charts, business diagram, learn business diagrams, flow diagrams.
Picture: The Best Mac Software for Diagramming or Drawing
Related Solution:
Make diagrams, charts, workflows, flowcharts, org charts, project charts easily with ConceptDraw software.
Picture: Best Program to Make Diagrams
Related Solution:
ConceptDraw DIAGRAM software extended with Flowcharts Solution from the "Diagrams" Area is a powerful software that will help you design the flowcharts for any business and technical processes, and software algorithms thanks to the predesigned flow chart symbols. Flowcharts solution offers 2 libraries with large collection of vector flow chart symbols: Flowchart Library, Flowcharts Rapid Draw Library that you can use to create your flowcharts quick and easy. Flowchart Solution is number of diagraming stencils including special set of flow chart symbols such as: terminator, process, decision which indicates a decision points between two or more paths in a flowchart, symbol of delay. Major symbols includes symbol of data, document or multiple documents, subroutine, preparation for processing of documents. Also includes symbols: display, manual input, manual loop, loop limit, stored data,connectors and suming junctions, sort and merge operations, symbols of database and internal stor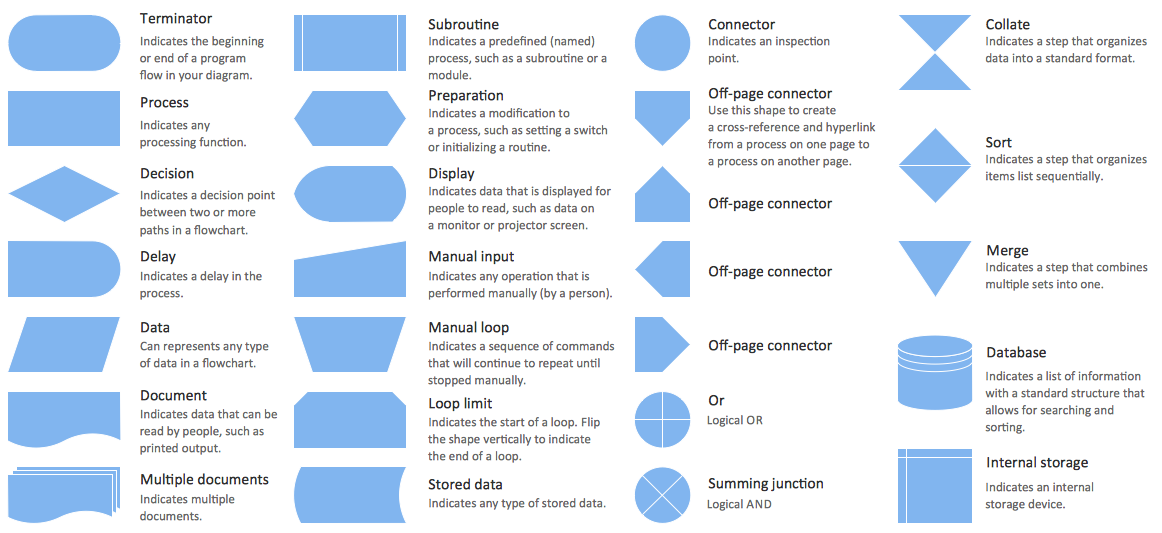
Picture: Flow Chart Symbols
Related Solution:

