Cause and Effect Analysis
Management and Planning tools
ConceptDraw OFFICE suite is a software for decision making. The Seven Management and Planning Tools is a tool for Cause and Effect Analysis that allows users to analyze the root causes for factors that influenced the problem. This diagram is constructed separately for each highly prioritized factor. The Diagram is then used for further formulation of potential actions.

Pic.1 Cause and Effect Analysis. Root Cause Analysis Tree Diagram Template
With a root cause identified, you can work on causation, and solutions to implement that will address this problem. Problems and solutions are displayed side by side to help when analyzing.
See also:
NINE RELATED HOW TO's:
No security system cannot be constructed without detailed security plan, or even a set of plans in some cases. ConceptDraw DIAGRAM software offers the Security and Access Plans Solution from the Building Plans Area to help you design the Security Plans for any premises and of any complexity.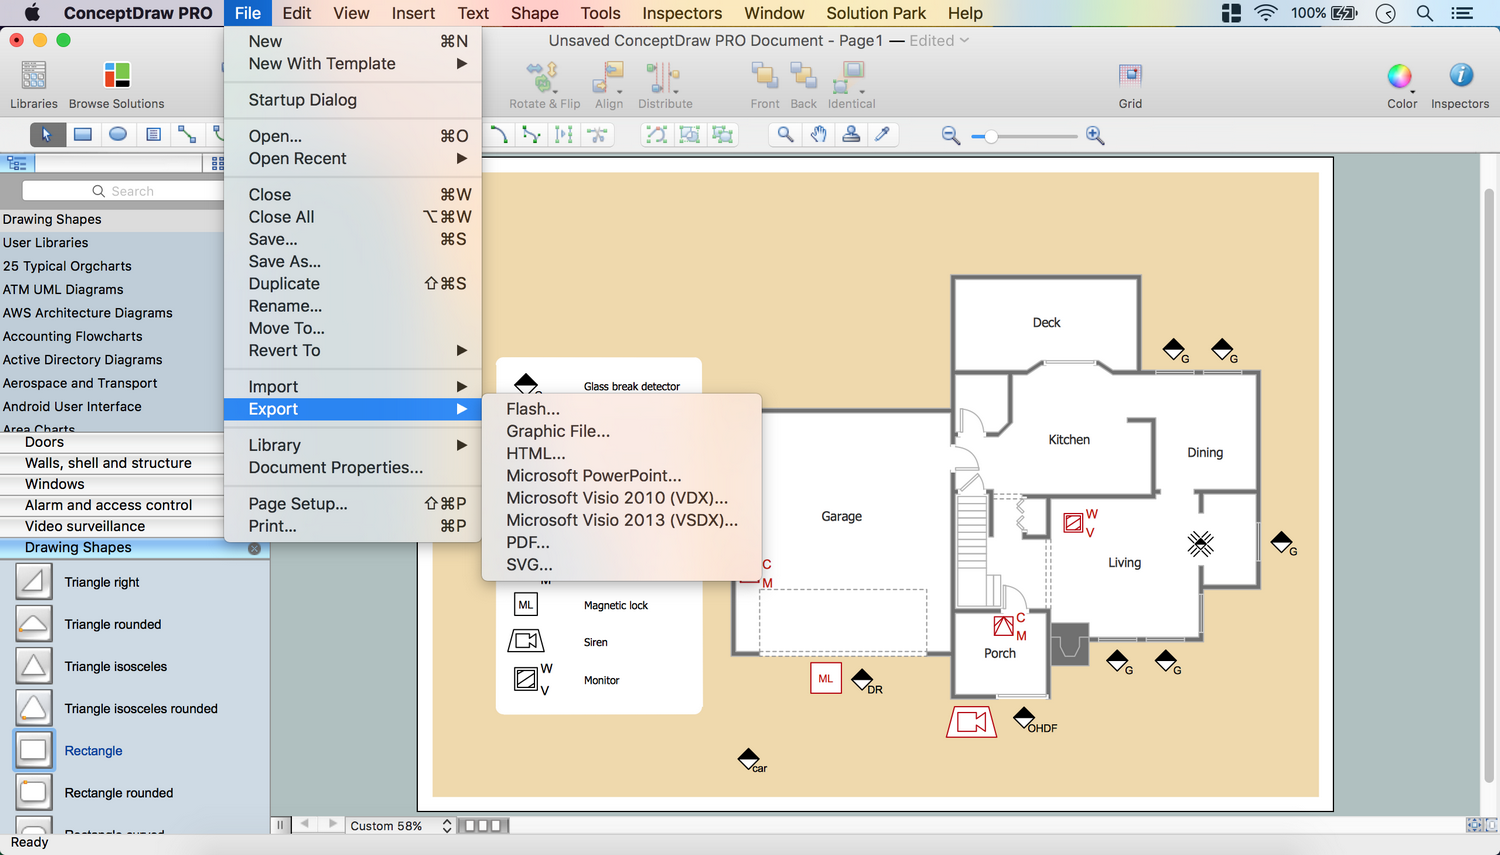
Picture: Security Plans
Related Solution:
When thinking about data visualization, one of the first tools that comes to mind is a flowchart design. You can find flowchart symbols, shapes, stencils and icons easily on the Internet, but it might take time to systematize this information. Nevertheless, once you start flowcharting, you’ll love its simplicity and efficiency.
This diagram consists from standard flowchart symbols, approved by ANSI (American National Standard Institute) for drawing flowcharts. A flowchart is a diagram that represents a step-by-step algorithm of any process, displaying the process stages as boxes that are connected with arrows. Flowchart design makes it clear and readable.
Flowchart designed using ConceptDraw DIAGRAM flowchart software allows to make attractive and clear process presentation, it makes interpretation of the business process flow fresh and versatile. Great flowchart design view is a big advantage over the diagram created manually on a paper.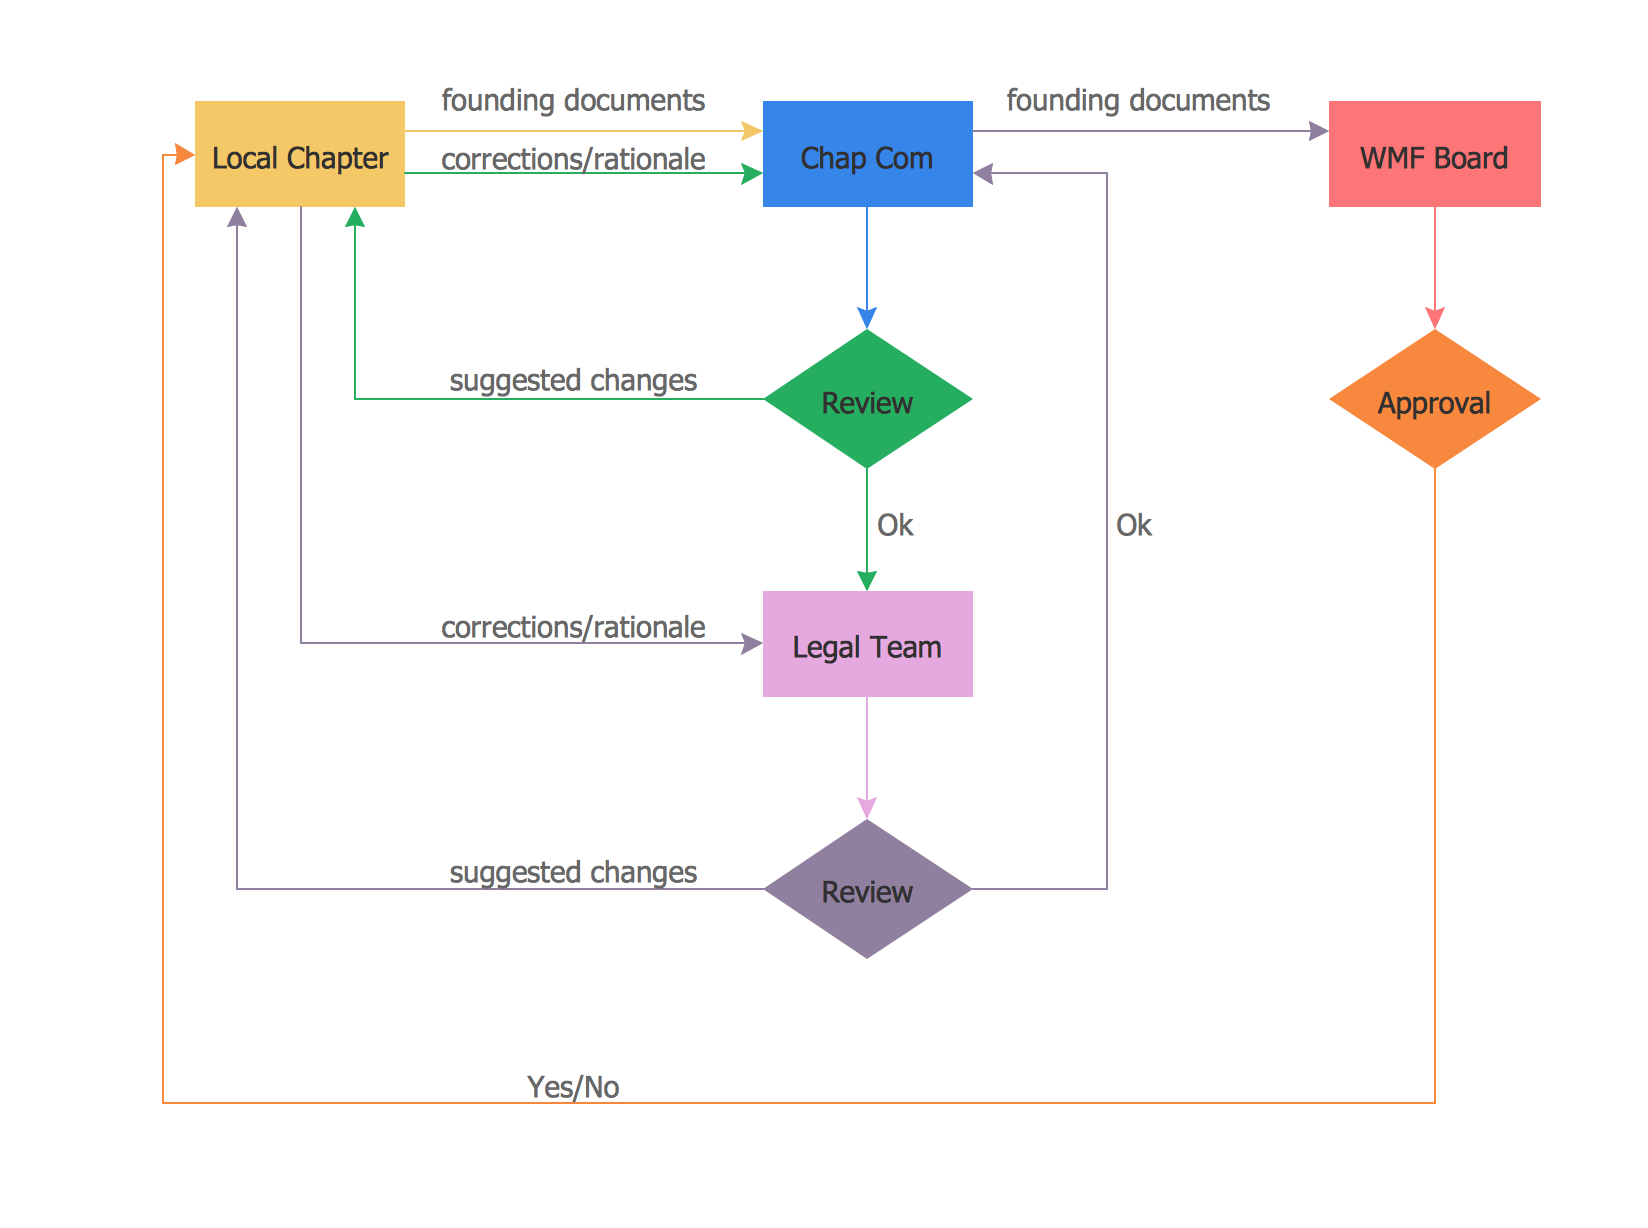
Picture: Flowchart design. Flowchart symbols, shapes, stencils and icons
Related Solution:
Pyramid chart example is included in the Pyramid Diagrams solution from Marketing area of ConceptDraw Solution Park.
Picture: Pyramid Diagram
Related Solutions:
The Onion Diagram is a type of circular diagram which consists of the core circle and concentric circles that look like the cross sections of onion. The key value of the Onion Diagram is to visually demonstrate the relationships that lead to a successful final product or deliverable.
Design of Onion Diagrams and Stakeholder Onions Diagrams is a complex process, but ConceptDraw DIAGRAM diagramming and vector drawing software makes it easier thanks to the Stakeholder Onion Diagrams Solution from the Management Area of ConceptDraw Solution Park, and the set of included libraries and Onion Diagram templates.
Picture: Onion Diagram Templates
Related Solution:
The ConceptDraw DIAGRAM Planogram Software and Retail Plan Software offers powerful tools of Enterprise Architecture Diagrams Solution for visualization the market analysis and easy making successful Retail Plans and Planograms with useful detailed recommendations about placing products and optimization the shelf space.
Picture: Planogram Software and Retail Plan Software
Related Solution:
To support you in your tasks you can use the power of ConceptDraw DIAGRAM providing
intelligent vector graphics that are useful for marketing diagramming and
ConceptDraw MINDMAP for key marketing mind maps.
Picture: Business Productivity - Marketing
Related Solution:
Analyze the root causes of factors that influence the problem. A diagram is constructed separately for each high priority factor.
Identify the root causes for a factor and then list possible corrective action.
The diagram displays the structure of causes for a factor and possible corrective actions.
The Root Cause Tree Diagram is used for further formulation of actions.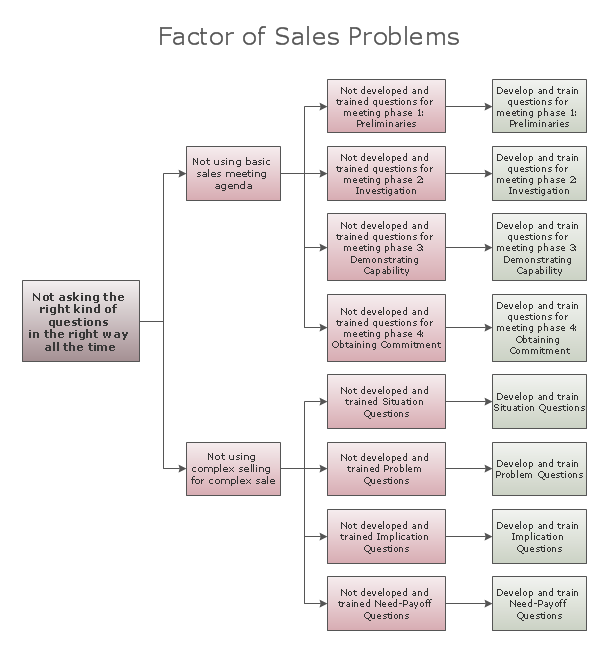
Picture: Root Cause Tree Diagram
Related Solution:
Fishbone Diagram, also referred as Cause and Effect diagram or Ishikawa diagram, is a fault finding and problem solving tool. Construction of Ishikawa diagrams is quite complicated process and has a number of features.
Fishbone Diagrams solution included to ConceptDraw Solution Park contains powerful drawing tools and a lot of examples, samples and templates. Each Fishbone diagram example is carefully thought-out by experts and is perfect source of inspiration for you.
Picture: Fishbone Diagram Example
Related Solution:
ConceptDraw
DIAGRAM 17