Cause and Effect Diagrams
Cause and Effect Diagrams (also known as Ishikawa or Fishbone diagrams) are the management tools widely used in business organizations. Cause and Effect Diagrams helps to consider all possible causes of the problem and to carry out the careful analysis of a situation. It is one of the seven basic tools of quality control and is widely used for definition the components needed for desired outcomes. This diagram was named Fishbone diagram because it is similar from the side on a fish skeleton with the fish head at the right and the bones at the left.
Cause and Effect Diagrams are designed to identify the potential factors that cause an overall effect. The causes are grouped into the categories, each cause is a source of variation.
ConceptDraw DIAGRAM powerful diagramming and vector drawing software provides the Fishbone Diagrams solution from the Management area of ConceptDraw Solution Park that allows to design the Cause and Effect Diagrams quick, easy and effective.

Example 1. Cause and Effect Diagrams in ConceptDraw DIAGRAM /p>
Fishbone Diagrams Solution contains the wide set of ready-to-use predesigned vector stencils, templates and samples that will help you create the professional looking Cause and Effect Diagrams in a few minutes.

Example 2. Export Fishbone Diagram to PDF, PPT, Visio
ConceptDraw DIAGRAM software offers also wide export opportunities for you. After finishing design your diagram, you can easy export it to one of graphical formats, or to PDF, PPT, Visio format for further useful exchanging with your colleagues or other interested people.

Example 3. Cause and Effect Diagram - Variation of Resin Output
This sample was created in ConceptDraw DIAGRAM software using the tools of the Fishbone Diagrams Solution. An experienced user spent 10 minutes creating this Cause and Effect Diagram in ConceptDraw DIAGRAM
Use the Fishbone Diagrams Solution for ConceptDraw DIAGRAM Solution Park for effective cause and effect analysis and easy Cause and Effect Diagrams creating.
All source documents are vector graphic documents. They are available for reviewing, modifying, or converting to a variety of formats (PDF file, MS PowerPoint, MS Visio, and many other graphic formats) from the ConceptDraw STORE. The Fishbone Diagrams Solution is available for all ConceptDraw DIAGRAM or later users.
TEN RELATED HOW TO's:
When you have some problems you need first to explore the reasons which caused them. Cause and Effect Analysis is a perfect way to do this. ConceptDraw DIAGRAM software enhanced with Fishbone Diagrams solution from the Management area of ConceptDraw Solution Park gives the ability to draw fast and easy Fishbone diagram that identifies many possible causes for an effect.
Picture: Cause and Effect Analysis
Related Solution:
ConceptDraw DIAGRAM has the powerful tools for rapid drawing Fishbone diagrams and identifying many possible causes for an effect for problem solving. Causes can be grouped into major categories to identify these sources of variation. Easy create Fishbone diagrams with the ConceptDraw DIAGRAM software and Fishbone Diagrams solution included to ConceptDraw Solution Park!
Picture: Create Fishbone Diagrams with the ConceptDraw
Related Solution:
UML Deployment diagram describes the hardware used in system implementations and the execution environments and artifacts deployed on the hardware.
ConceptDraw has 393 vector stencils in the 13 libraries that helps you to start using software for designing your own UML Diagrams. You can use the appropriate stencils of UML notation from UML Deployment library.
Picture: UML Deployment Diagram. Design Elements
Related Solution:
Any business process consists from a number of tasks carrying out the certain business goal. It is useful to diagram business processes to ensure that they are as foolproof, logical and sequential as possible. This business process diagram describes a typical booking process flow by the example of a cab booking process. It can be used as a roadmap for any booking system implementation. Diagramming a business process allows you to look at the entire project and take into account all types of possible scenarios. Business process diagram helps you investigate and clarify the process thoroughly so that you can find out how it can be improved. Business process diagram supports team communications by ensuring that each process element is clear and everyone in the team is on the same page.
Sometimes your company brings you less profit than you expect it to be, and it’s difficult to reveal the causes. Maybe it’s time to learn new technologies, because business diagram are easily developed by means of special software, so you won’t make any extra effort. In return, you will increase your productivity and get more done in a less time.
Picture: Business Diagram Software
Related Solutions:
Fishbone Diagram, also referred as Cause and Effect diagram or Ishikawa diagram, is a fault finding and problem solving tool. Construction of Ishikawa diagrams is quite complicated process and has a number of features.
Fishbone Diagrams solution included to ConceptDraw Solution Park contains powerful drawing tools and a lot of examples, samples and templates. Each Fishbone diagram example is carefully thought-out by experts and is perfect source of inspiration for you.
Picture: Fishbone Diagram Example
Related Solution:
Fishbone Diagram is another name for the Cause and Effect Diagram or the Ishikawa Diagram which got its name from the fact that it looks like a fish skeleton. Developed by Kaoru Ishikawa in 1968, a Fishbone Diagram is effectively used for a cause and effect analysis which allows to consider all possible causes for a certain problem or event.
ConceptDraw DIAGRAM supplied with Fishbone Diagrams solution from the Management area is the best software for fast and easy drawing professional looking Fishbone Diagram.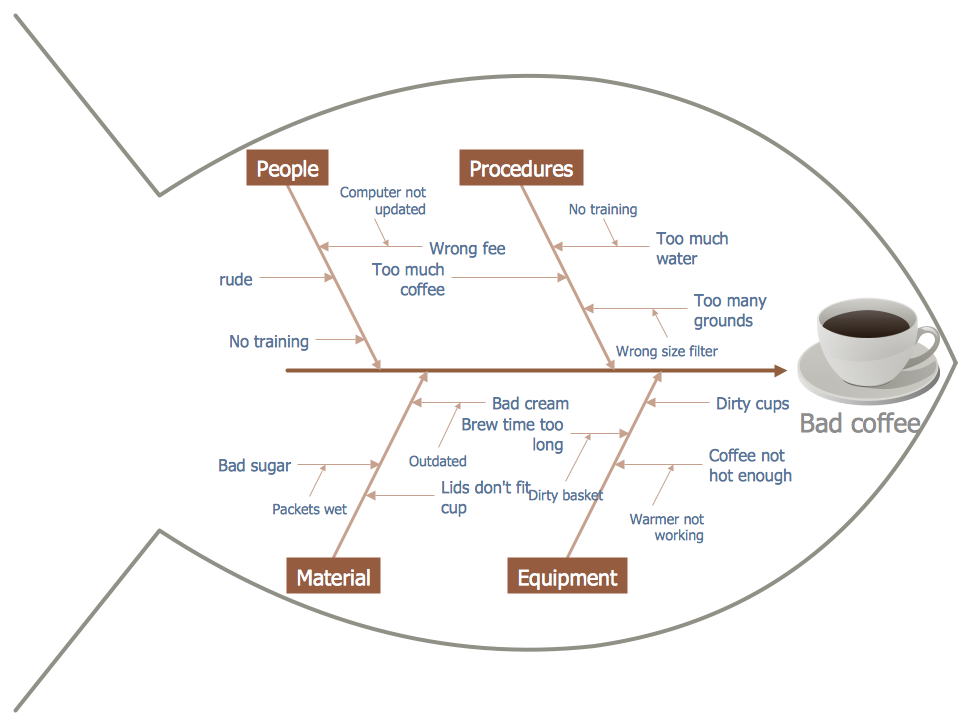
Picture: Fishbone Diagram
Related Solution:
ConceptDraw DIAGRAM diagramming and vector drawing software supplied with Sales Dashboard solution from the Marketing area of ConceptDraw Solution Park provides the full set of useful tools which make it the best for producing the live KPI Dashboard of any complexity.
Picture: KPI Dashboard
Related Solution:
Mechanical design is a labour-intensive process. To facilitate the task of Mechanical Engineering Diagrams creating, ConceptDraw DIAGRAM diagramming and vector drawing software was extended with Mechanical Engineering solution from the Engineering area. Now, ConceptDraw DIAGRAM is a powerful Mechanical Design Software.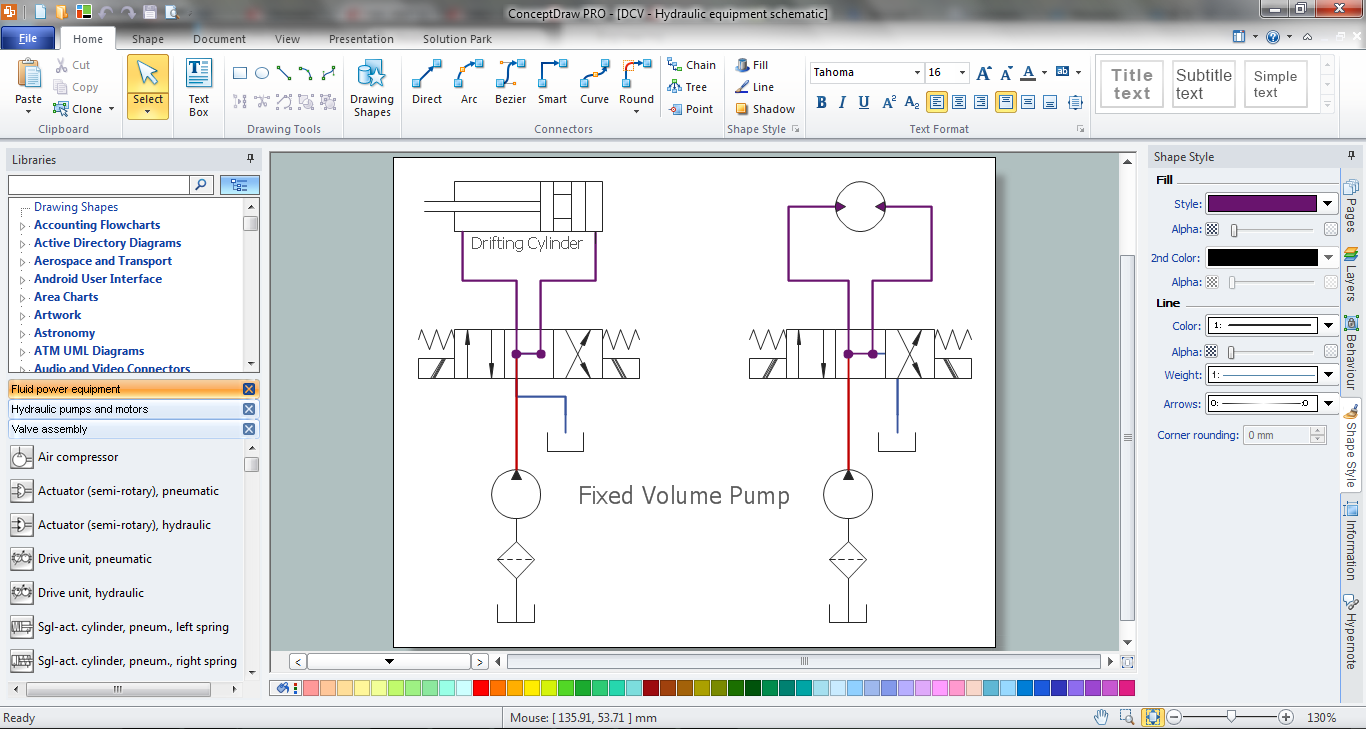
Picture: Mechanical Design Software
Related Solution:
How to design a Bubble Chart? It’s very easy! All that you need is a powerful software. Never before creation of a Bubble Chart wasn’t so easy as now with tools of Business Diagrams Solution from the Management Area for ConceptDraw Solution Park.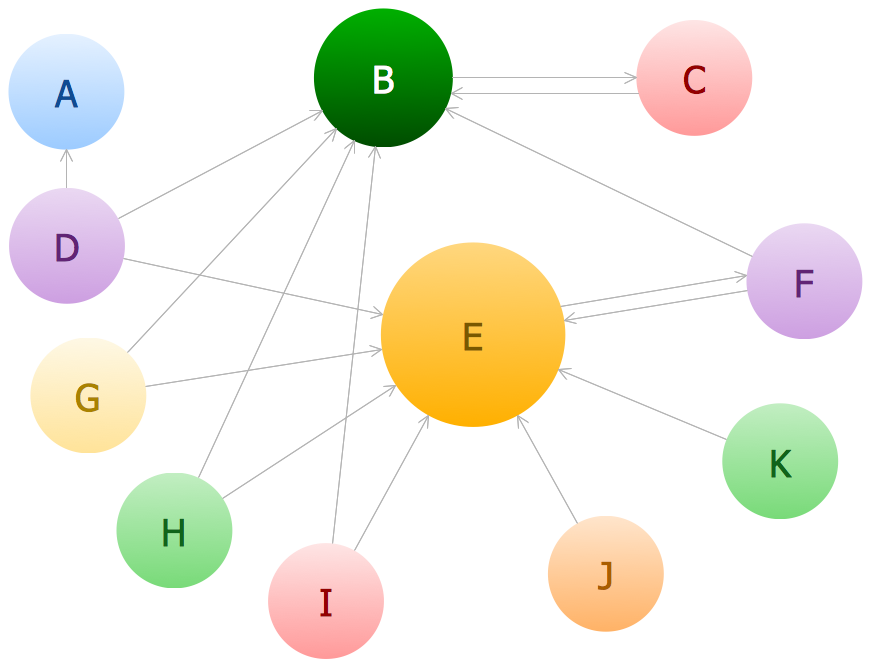
Picture: Bubble Chart
Related Solution:
A causal model is an abstract concept, that describes the causal mechanisms of a system, by noting certain variables and their influence on each other, in an effort to discover the cause of a certain problem or flaw. This model is presented in diagram form by using a fishbone diagram.
ConceptDraw DIAGRAM diagramming and vector drawing software enhanced with Fishbone Diagrams solution helps you create business productivity diagrams from Fishbone diagram templates and examples, that provide to start using of the graphic method for the analysis of problem causes. Each predesigned Fishbone Diagram template is ready to use and useful for instantly drawing your own Fishbone Diagram.
Picture: Fishbone Diagram Template
Related Solution:

