Bubble Plot
This sample was created in ConceptDraw DIAGRAM diagramming and vector drawing software using the Bubble Diagrams Solution from the "Diagrams" area of ConceptDraw Solution Park.
This sample shows the BCG (Boston Consulting Group) matrix that is used in marketing and product management for strategic analysis and planning. BCG matrix shows the position of the company’s products on the market, allows to classify the products and analyse their relevance. The products are represented as circles, the size of the circles displays the sales volume.

Pic. 1. Bubble Plot
Using the Bubble Diagrams Solution for ConceptDraw DIAGRAM you can create your own professional Bubble Diagrams quick and easy.
The Bubble Diagrams produced with ConceptDraw DIAGRAM are vector graphic documents and are available for reviewing, modifying, and converting to a variety of formats (image, HTML, PDF file, MS PowerPoint Presentation, Adobe Flash or MS Visio).
Download Full Software Package and View Examples for Free
More Related Diagrams:
SIX RELATED HOW TO's:
The onion diagram is a type of diagram which shows the dependencies among parts of an organization or process. The items are displayed at the concentric circles, where the items at the bigger rings depend on the items at the smaller rings.
ConceptDraw DIAGRAM diagramming and vector drawing software extended with Stakeholder Onion Diagrams Solution from the Management Area of ConceptDraw Solution Park is a professional Onion Diagram Maker.
Picture: Onion Diagram Maker
Related Solution:
Using diagrams is the easiest way to explain the soccer formations. The Soccer solution from the Sport area of ConceptDraw Solution Park is designed as a tool that helps you produce the soccer diagrams in a few minutes. The predesigned samples of the Soccer solution for ConceptDraw DIAGRAM depict the most popular formation diagrams.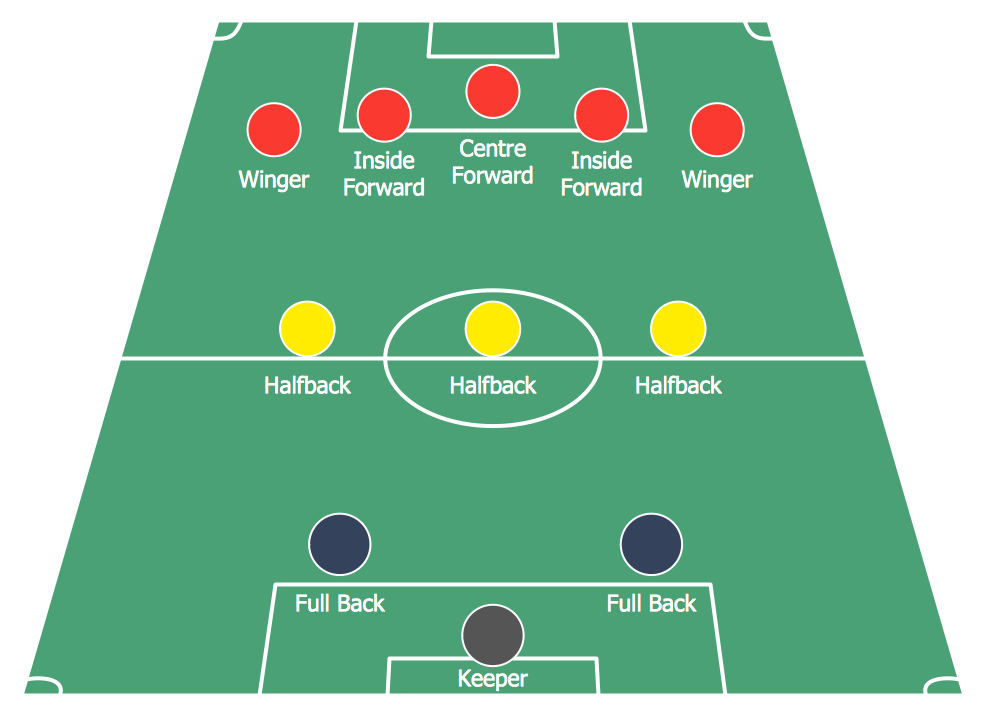
Picture: Soccer (Football) Formation
Related Solution:
This sample shows the Scatter Plot without missing categories. It’s very important to no miss the data, because this can have the grave negative consequences. The data on the Scatter Chart are represented as points with two values of variables in the Cartesian coordinates. This sample can be used in the engineering, business, statistics, analytics, at the creating the financial and other types of reports.
Picture: Blank Scatter Plot
Related Solution:
ConceptDraw DIAGRAM diagramming and vector drawing software extended with Business Diagrams Solution from the Management Area is a powerful Bubble Chart Maker.
Picture: Bubble Chart Maker
Related Solution:
These donut chart templates was designed using ConceptDraw DIAGRAM diagramming and vector drawing software extended with Pie Charts solution from Graphs and Charts area of ConceptDraw Solution Park.
All these donut chart templates are included in the Pie Charts solution.
You can quickly rework these examples into your own charts by simply changing displayed data, title and legend texts.
Picture: Donut Chart Templates
Related Solution:
Living room is the place where all family comes together, where receive guests. The interior of the living room complements the piano which helps to create a warm atmosphere. The piano is not just a musical instrument, in the room interior it becomes the most noticeable detail. The piano always organically entered in any interior.
Best Interior Design Software for Mac OS&Windows ConceptDraw DIAGRAM allows you design the interior of your dreams quick and easy.
Picture: Living Room. Piano in plan
Related Solution: