Activity on Node Network Diagramming Tool
The Activity-on-Node (also called Precedence Diagramming Method) is a method that uses the nodes or boxes to represent activities and the arrows to show the logical dependencies between activities. The activity information is written in the nodes, it is usually numeric. Each activity has a unique number.
There are 4 relationships between activities:
- finish-to-start,
- start-to-start,
- finish-to-finish,
- start-to-finish.
The Activity-on-Node (AON) that shows which activities must be completed in order to other activities will start is called “finish-to-start”. It is the most used relationship.
This sample shows the Activity on node network diagramming method. It was created in ConceptDraw DIAGRAM diagramming and vector drawing software using the Seven Management and Planning Tools solution from the Management area of ConceptDraw Solution Park.

Example.1 Activity on Node Network Diagramming Tool - Activity on Node Network Diagramming Method (macOS and Windows)
Use the ready-to-use objects, templates and samples from the Seven Management and Planning Tools Solution for ConceptDraw DIAGRAM to create your own professional looking activity on nodes network diagrams quick and easy.

Example.2 Activity on Node Network Diagramming Tool — Seven Management and Planning Tools Solution
The activity on nodes diagrams produced with ConceptDraw DIAGRAM are vector graphic documents and are available for reviewing, modifying, and converting to a variety of formats (image, HTML, PDF file, MS PowerPoint Presentation, Adobe Flash or MS Visio).
TEN RELATED HOW TO's:
There are many ways to describe a database structure. One of the most usual is to draw an entity relationship diagram (ERD) using a Crow’s Foot notation to represent database elements. If you don’t want to draw it on paper, you should use an appropriate software.
An entity-relationship (ER) diagram is used to show the structure of a business database. ERD represents data as objects (entities) that are connected with standard relationships symbols which Illustrate an association between entities. ERD, there is a wide range of ERD notations used by data bases architects for reflecting the relationships between the data entities. According to the crow’s foot notation relationships are drawn as single labeled lines designating a certain kinds of relationship. Crow foot notation is a most frequently used ERD standard, because of improved readability of diagrams, with a more accurate use of space on the page._Win_Mac.png)
Picture: Entity Relationship Diagram - ERD - Software for Design Crows Foot ER Diagrams
Related Solution:
You need to draw Authority Matrix Diagram quick and easy? Design it with ConceptDraw DIAGRAM!
ConceptDraw DIAGRAM extended with Seven Management and Planning Tools solution from the Management Area is the best Authority Matrix Diagram Software.
Picture: Authority Matrix Diagram Software
Related Solution:
Create value stream maps - for value stream analysis and value stream management, material and information flow mapping, using our quick start templates included with ConceptDraw.
Picture: Best Value Stream Mapping mac Software
Related Solution:
What is landscape design? It's a floor plan but for an outdoor area.
Same as a floor plan, a landscape design represents visually any site using scaled dimensions.
The main purpose of landscape design is to plan the layout for an outdoor area no matter is it a personal site plan for your home or a commercial plan for business. It may also be handful when a new installation, repair or even an outdoor event is planning.
It helps to calculate time and decide which materials should be used in your project. Landscape designs perfectly gives the property owner and landscape contractor better vision for cost estimation, helping to ensure the project time and budget.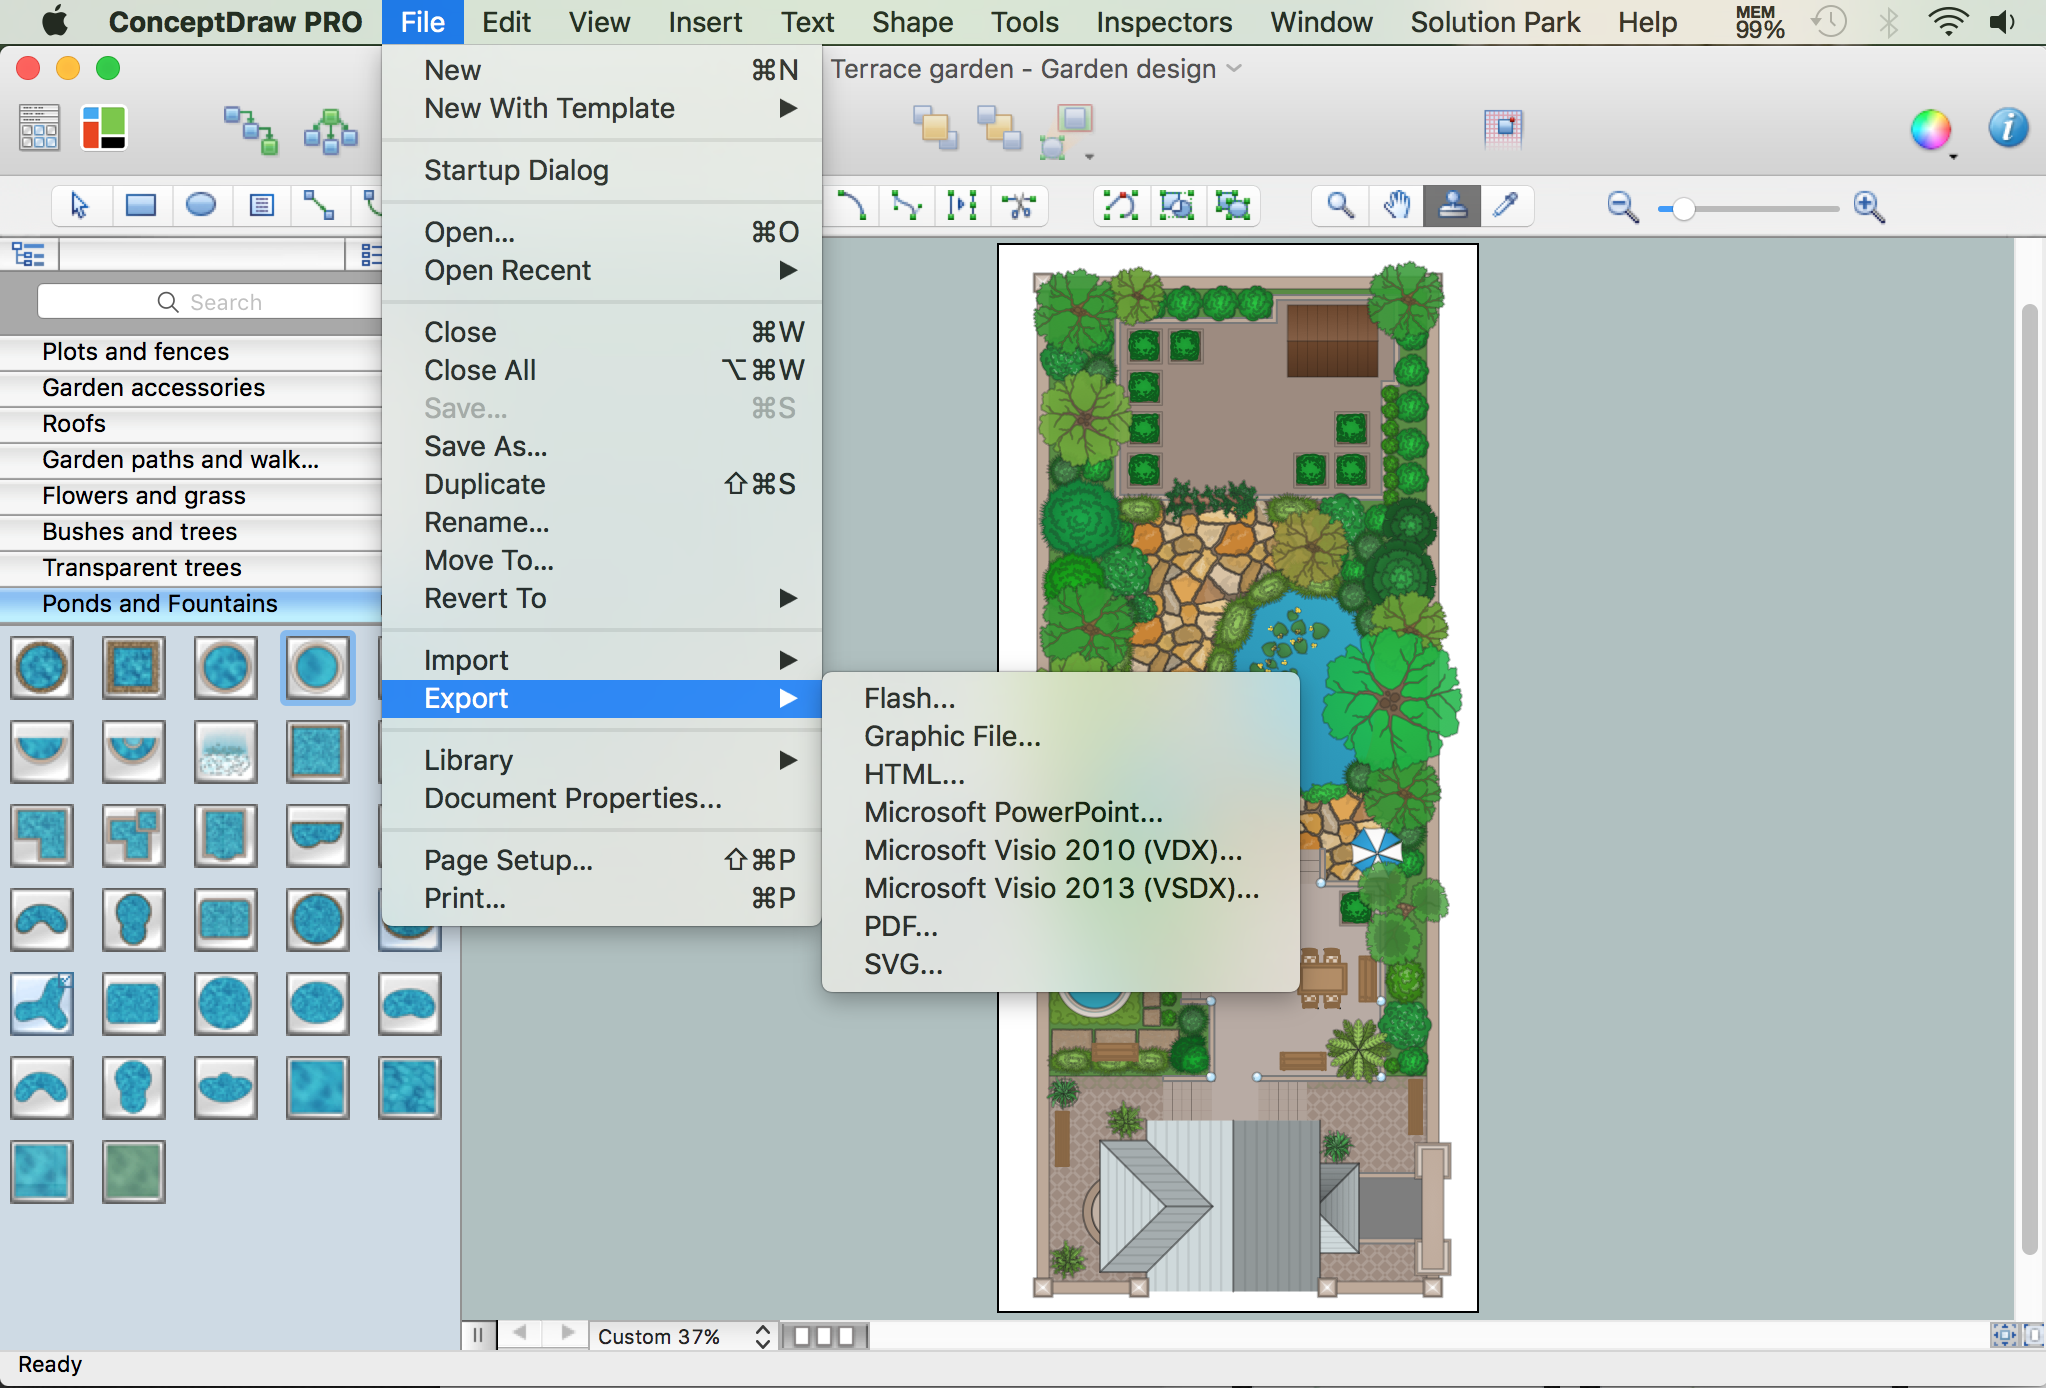
Picture: How to Draw a Landscape Design Plan
Related Solution:
Process Flow Chart is a visual illustration of overall flow of activities in producing a product or service. How do you make a Process Flow Chart usually? Drawing process flow charts, diagrams and maps is quite complex and lengthy process, especially if you draw free-hand. But now thanks to the ConceptDraw DIAGRAM diagramming and vector drawing software extended with Flowcharts solution from the "Diagrams" area of ConceptDraw Solution Park this process became simple and fast. A confirmation of this can serve many Process Flow Chart examples included in Flowcharts solution.
Picture: Process Flow Chart Examples
Related Solution:
ConceptDraw DIAGRAM is a professional diagramming and vector drawing software. Now, enhanced with SysML Solution from the Software Development Area of ConceptDraw Solution Park, ConceptDraw DIAGRAM became an ideal software for model based systems engineering (MBSE).
Picture: Model Based Systems Engineering
Related Solution:
The reliability is a cornerstone for any corporate computer network. If you want to provide a high fault tolerance, a mesh network topology would be the solution. The main advantage of this network is that every node can work as a commutator, although it’s not easy to set up this kind of network.
A mesh network topology may be full, or partial. Full mesh network means that each node of the network (computer, workstation or other equipment) is connected directly to each of the other nodes. A partial mesh topology means that a part of nodes are connected with a whole network, and the other part of nodes are only connected to those equipment, they exchange the majority of data. This illustration shows schematic diagram of a partial mesh network containing six nodes. Each node is represented as a circles and connections are drawn as straight lines. The connections may be both wired and wireless. This scheme can be used to make the specific logical or physical network diagrams by means the ConceptDraw Computer and Networks solution.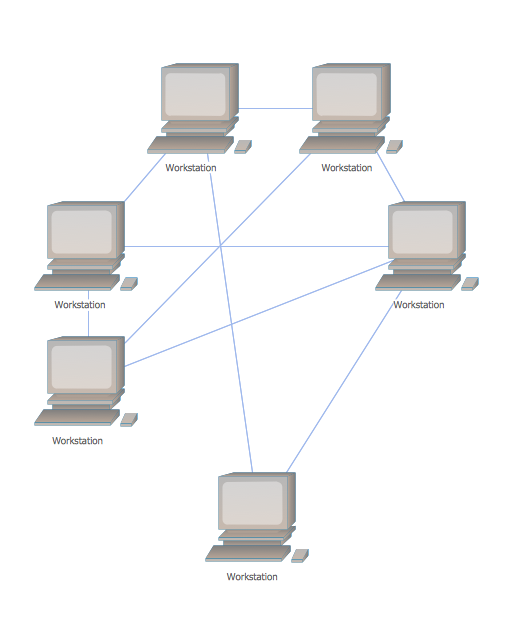
Picture: Mesh Network Topology Diagram
Related Solution: