3 Circle Venn Diagram. Venn Diagram Example
Venn's construction for 3 sets
This template shows the Venn Diagram. It was created in ConceptDraw DIAGRAM diagramming and vector drawing software using the ready-to-use objects from the Business Diagrams Solution from the Management area of ConceptDraw Solution Park.
Venn Diagrams visualize all possible logical intersections between several sets and are widely used in mathematics, logic, statistics, marketing, sociology, etc.

Example 1. 3 Circle Venn Diagram
This Venn Diagram shows the logical intersections between 3 sets.
Using the Business Diagrams Solution for ConceptDraw DIAGRAM you can create your own professional-looking Venn Diagrams quick and easy.
The Venn Diagrams produced with ConceptDraw DIAGRAM are vector graphic documents and are available for reviewing, modifying, and converting to a variety of formats (image, HTML, PDF file, MS PowerPoint Presentation, Adobe Flash or MS Visio).
TEN RELATED HOW TO's:
The growth–share matrix (BCG Matrix) was created by Bruce D. Henderson for the Boston Consulting Group in 1970 to help corporations to analyze their business units and to help the company allocate resources. How is it easy design the BCG Matrices in ConceptDraw DIAGRAM diagramming and vector drawing software supplied with unique Matrices Solution from the Marketing Area of ConceptDraw Solution Park.
Picture: BCG Matrix
Related Solution:
If you want to find a way to understand complex things in minutes, you should try to visualize data. One of the most useful tool for this is creating a flowchart, which is a diagram representing stages of some process in sequential order. There are so many possible uses of flowcharts and you can find tons of flow charts examples and predesigned templates on the Internet. Warehouse flowchart is often used for describing workflow and business process mapping. Using your imagination, you can simplify your job or daily routine with flowcharts.
Warehouse flowcharts are used to document product and information flow between sources of supply and consumers. The flowchart provides the staged guidance on how to manage each aspect of warehousing and describes such aspects as receiving of supplies; control of quality; shipment and storage and corresponding document flow. Warehouse flowchart, being actual is a good source of information. It indicates the stepwise way to complete the warehouse and inventory management process flow. Also it can be very useful for an inventory and audit procedures.
Picture: Flow chart Example. Warehouse Flowchart
Related Solution:
ConceptDraw DIAGRAM extended with Cross-Functional Flowcharts Solution from the Business Processes Area is the best software for quick and easy designing Cross Functional Flowchart of any complexity. Make sure in it right now!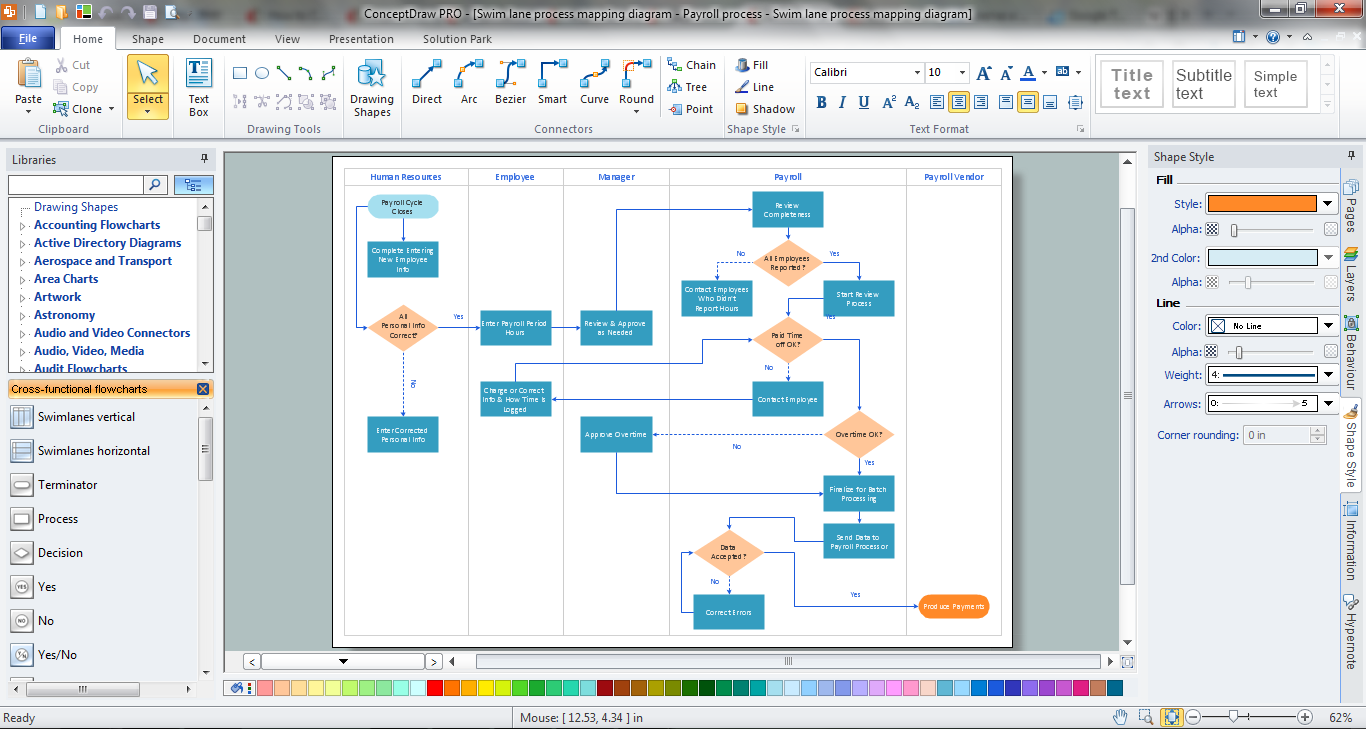
Picture: Cross Functional Flowchart
Related Solution:
The Microsoft Windows Azure platform is a highly flexible cloud-based solution with variety of services which supports not only the execution of.NET applications, but also allows developers to use programming languages like Java, PHP, Node.js, or Python.
ConceptDraw DIAGRAM diagramming and vector drawing software provides the Azure Architecture Solution from the Computer and Networks area of ConceptDraw Solution Park with a lot of useful tools which make easier: illustration of Windows Azure possibilities and features, describing Windows Azure Architecture, drawing Azure Architecture Diagrams, depicting Azure Cloud System Architecture, describing Azure management, Azure storage, documenting Azure services.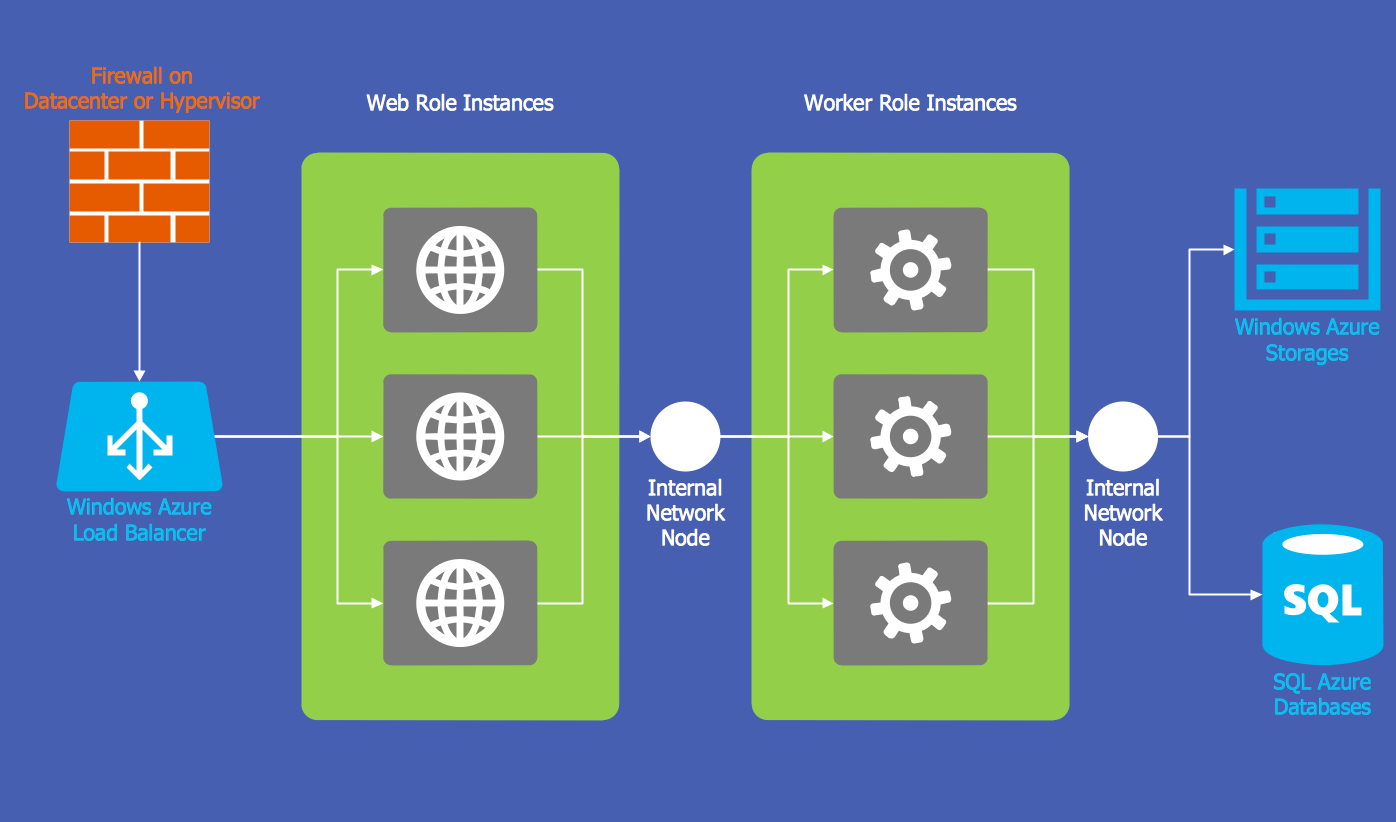
Picture: Windows Azure
Related Solution:
Unified Modeling Language (UML) is a graphical modeling language for describing, visualizing, projecting and documenting of object oriented systems. UML digram is used for modeling of organizations and their business processes, for development the big projects, the complex software applications. Comprehensive UML diagram allows to create the set of interrelated documents that gives the complete visual representation of the modeling system.
Picture: UML Sample Project
Related Solution: